
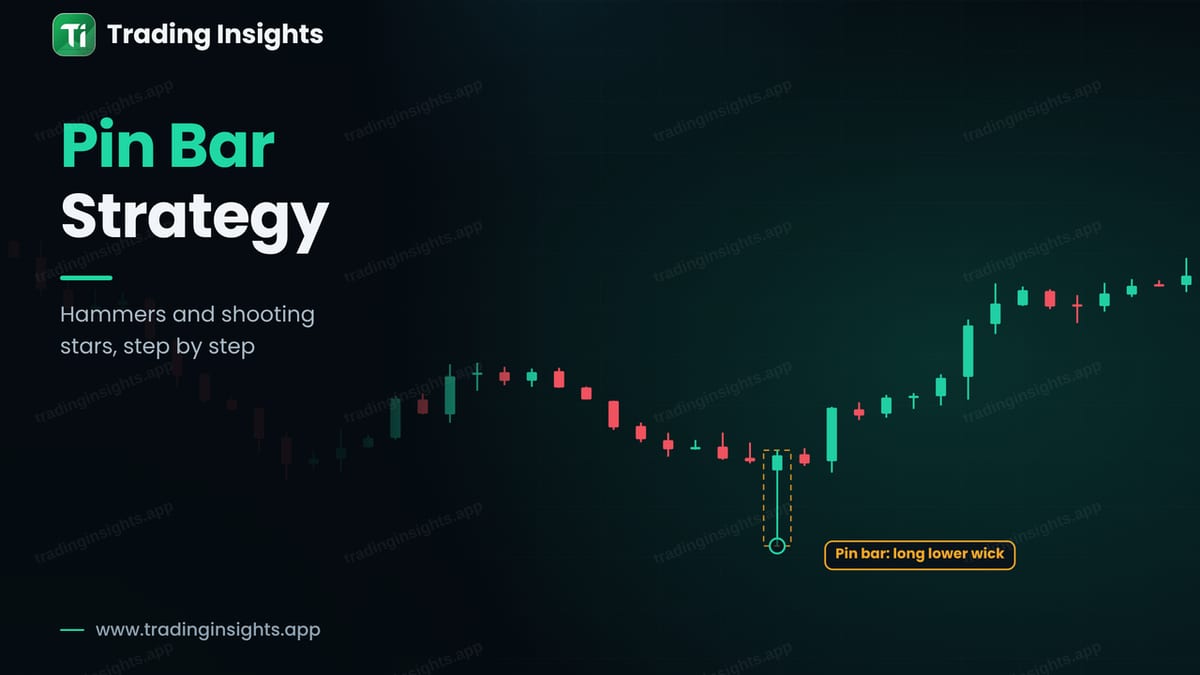
A pin bar, short for pinocchio bar, is a candle with a small body and a long wick, or tail, on one side. The long wick shows that price went far in one direction and was rejected, so that it closed back near where it opened. Traders use it as a sign that a level may be holding. In an uptrend or at support, the bullish version is called a hammer, and at resistance the bearish version is called a shooting star. This guide explains the anatomy of a pin bar, where to look for it, and how to trade it with a clear entry, stop and target.
Anatomy of a pin bar
A good pin bar has three features. The wick is long, usually at least two or three times the size of the body. The body is small and sits at one end of the candle. The opposite wick is short or missing. The shape tells a story: during the candle, sellers pushed price down hard, but buyers took it back, and the close is near the top.
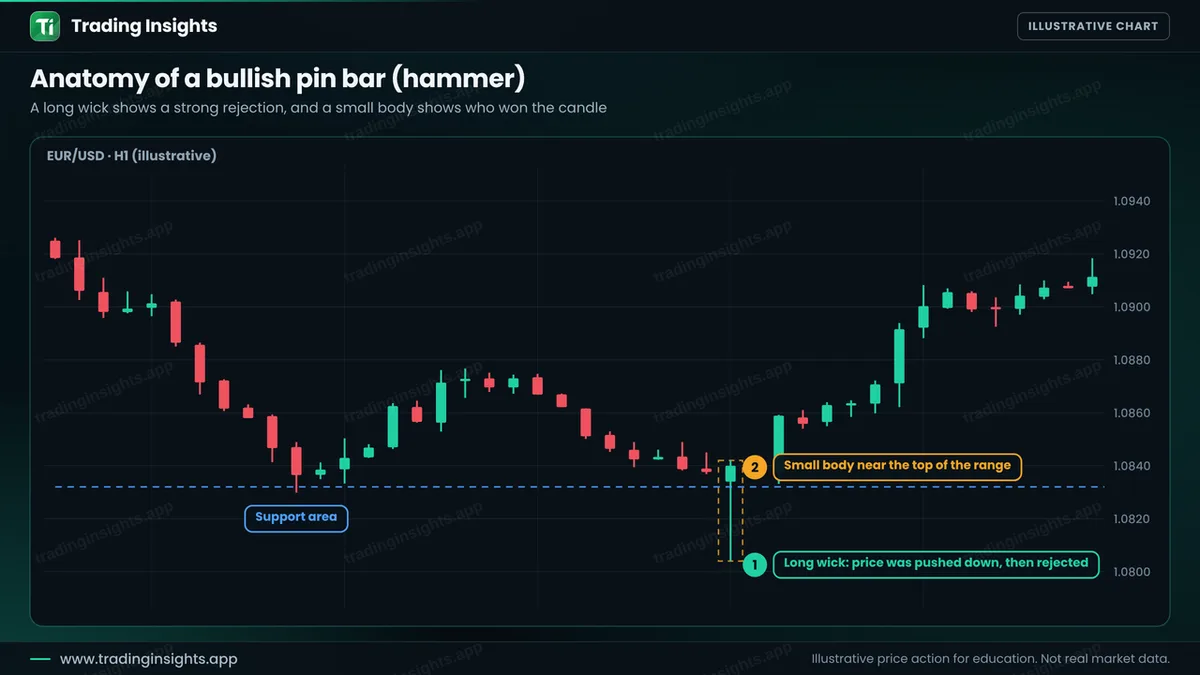
The pattern shows what happened and not what must happen next. A pin bar is a clue, and the quality of the setup depends on where it forms. For more about rejection, see candlestick patterns for beginners and liquidity sweeps, since a long wick often comes from a sweep of a level.
Hammer and shooting star
- Hammer (bullish): long lower wick, small body near the high, at support or after a fall.
- Shooting star (bearish): long upper wick, small body near the low, at resistance or after a rise.
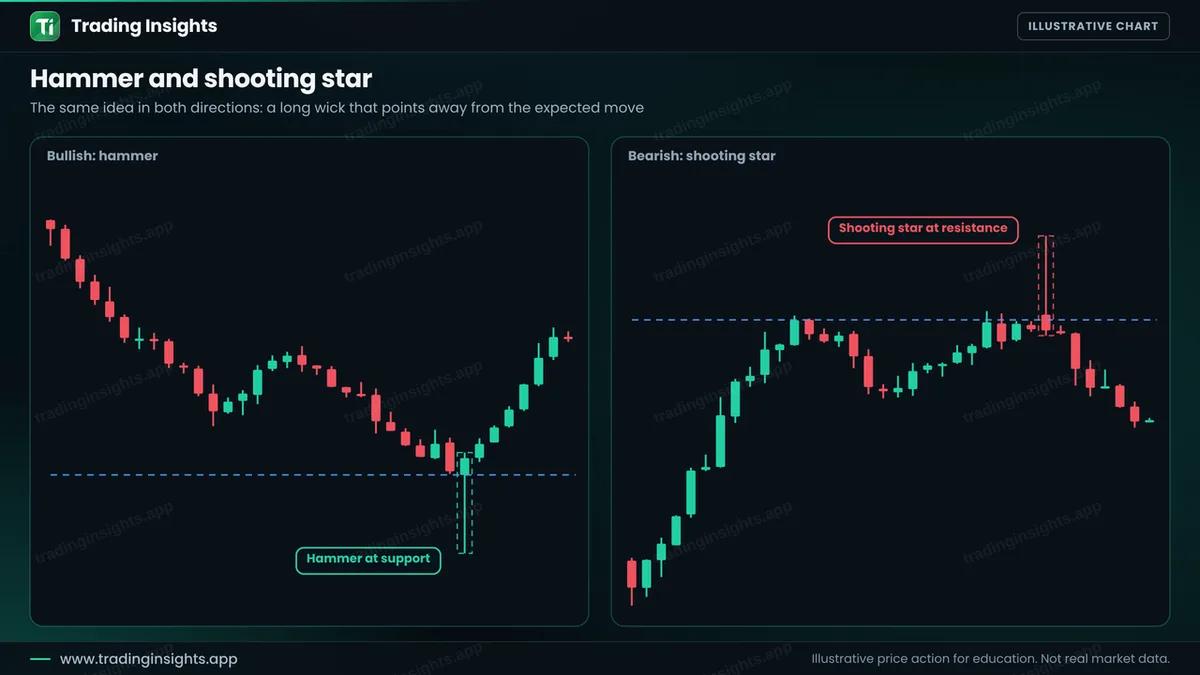
The color of the body matters less than the shape and the location. A bullish hammer with a small bearish body is still a hammer.
The rules, step by step
- Find a level. Support, resistance, a zone or the end of a pullback. A pin bar in the middle of nowhere has little value.
- Check the shape. A long wick and a small body. The wick should stand out from nearby candles.
- Wait for the close. A candle that looks like a pin bar mid-hour can change by the close.
- Place the entry. A buy stop just above the high of a hammer, or a sell stop just below the low of a shooting star. This waits for price to confirm.
- Place the stop. Beyond the end of the wick, with a small buffer.
- Set the target. A multiple of the risk, such as 2R, or the next level.
A worked trade
This is an illustrative buy on EUR/USD, H1. Price falls to a support area near 1.0832, and a hammer forms with a high at 1.0842 and a low at 1.0804. You place a buy stop at 1.0843, one pip above the high, and the stop loss at 1.0803, one pip below the low. The target is twice the risk.
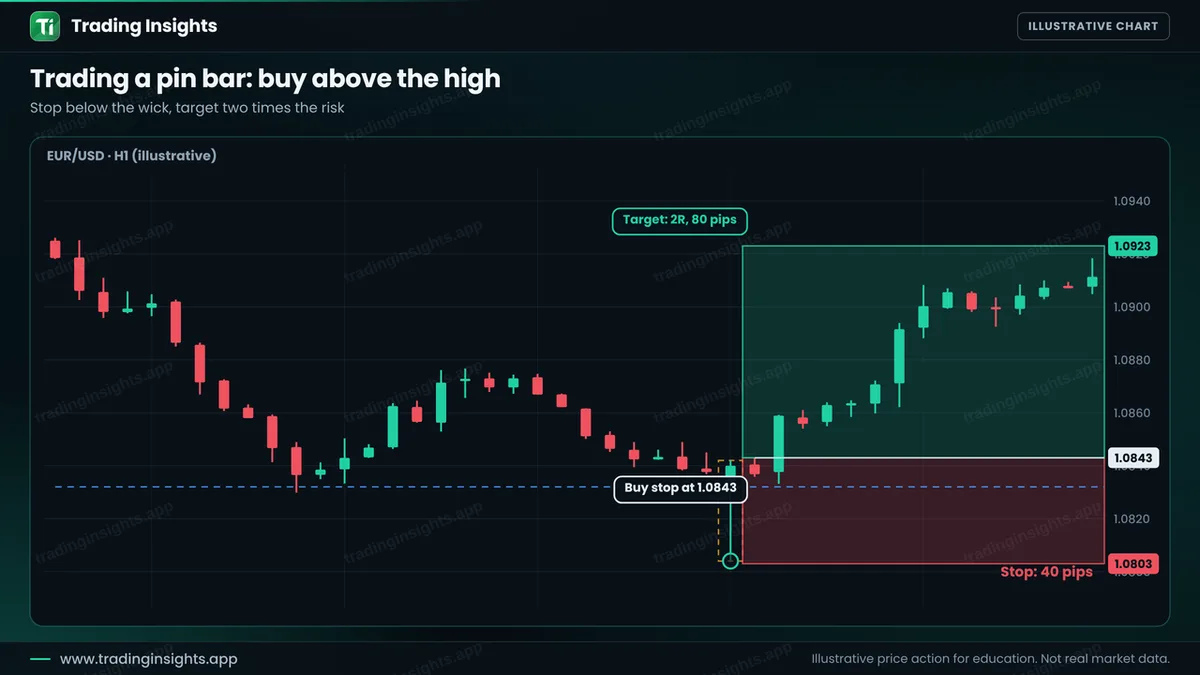
- Entry: 1.0843 (buy stop above the pin bar high).
- Stop loss: 1.0803, below the wick (40 pips).
- Take profit: 1.0923 (80 pips), a ratio of 1:2.
With a $10,000 account risking 1% ($100), the size is $100 / (40 pips x $10 per pip per lot) = 0.25 lot. A win pays about $200, and a loss costs about $100. The long wick makes the stop wide, so a very long pin bar can give a poor ratio. In that case some traders enter on a retest of the middle of the wick for a closer stop, but the trade may not trigger. Use the position size calculator to size it. For stop placement see stop loss and take profit.
Common mistakes
- Trading every long wick, including those far from any level.
- Entering before the pin bar has closed.
- Putting the stop inside the wick.
- Ignoring the trend. A hammer in a strong downtrend is less likely to work.
- Using a pin bar that is not larger than the candles around it.
Frequently asked questions
What is a pin bar in trading?
A candle with a long wick and a small body, which shows that price was rejected from one side.
What is the difference between a pin bar and a hammer?
A hammer is a pin bar with a long lower wick, seen after a fall. A shooting star is the pin bar with a long upper wick, seen after a rise.
How long should the wick be?
Many traders look for a wick at least two to three times the length of the body. There is no fixed rule, so choose one and test it.
Does a pin bar always reverse the market?
No. It can fail. It works best at a clear level and with confirmation, and you always need a stop loss.
Trading involves risk. This is education, not financial advice. The charts are illustrative and not real market data. Trading carries risk, and no method guarantees results.


