
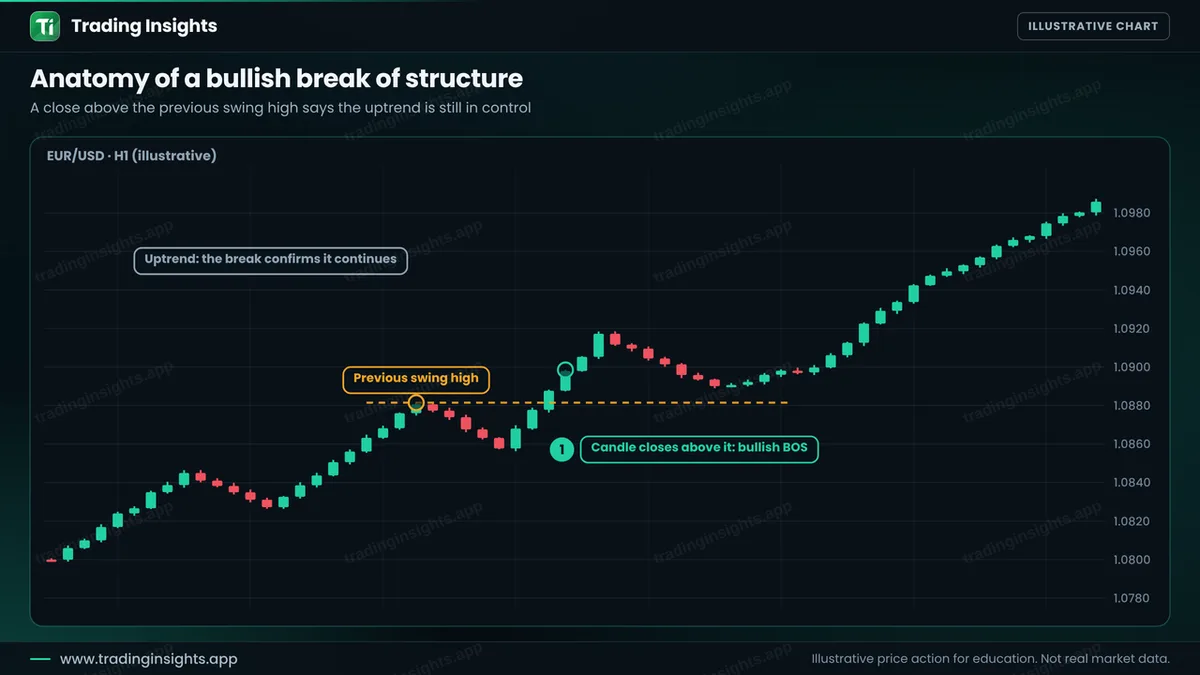
A break of structure, or BOS, happens when price closes beyond a swing point in the direction of the existing trend. In an uptrend, it is a close above the previous swing high. In a downtrend, it is a close below the previous swing low. It tells you that the trend is still doing what it did before, and that the market structure is intact. This guide explains how to identify a BOS, why a candle close matters more than a wick, and how to plan a buy on the pullback after the break.
What a BOS looks like
The steps are simple. First identify the trend from the sequence of swings, as in swing highs and lows. Then mark the last swing high. When a candle closes above it, you have a BOS. The break confirms that buyers can still push to new highs, and the pullback that follows often becomes the area where traders look to join the trend. It is the opposite of a change of character, which breaks against the trend. To see the wider idea, read what market structure is.
A wick is not enough
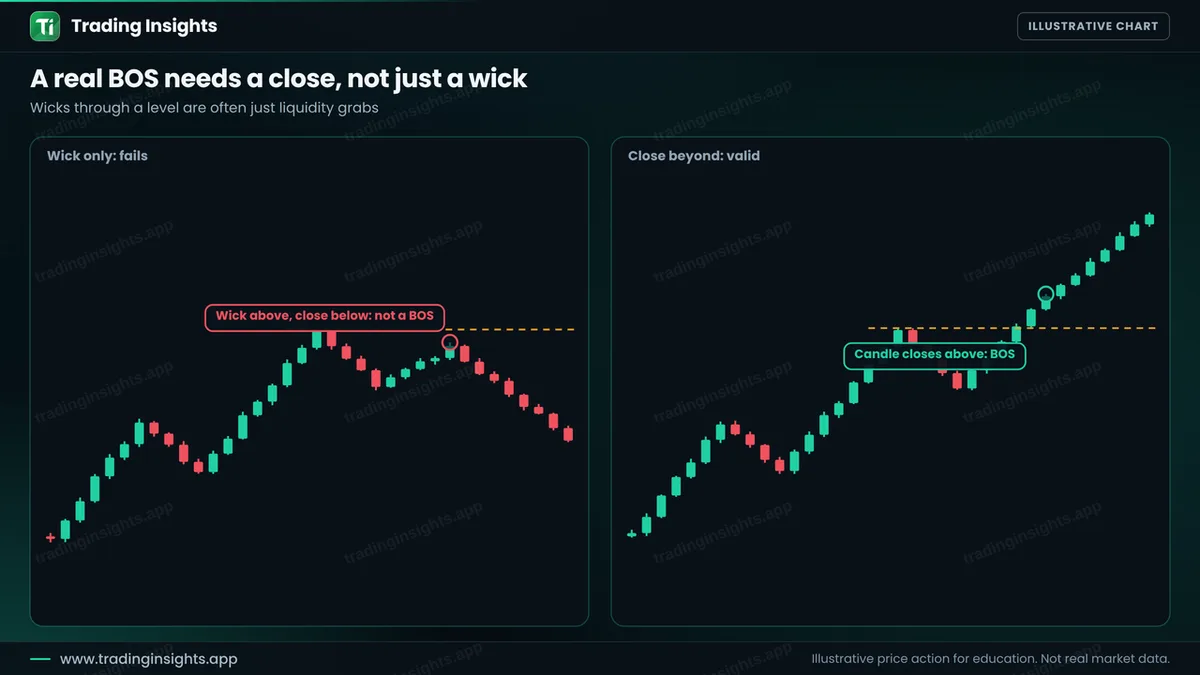
Many false breaks come from wicks. Price spikes above a high, triggers stops and breakout orders, and closes back below. This is a liquidity sweep, not a BOS. A simple rule is that you need a candle body to close beyond the level on your timeframe. Some traders also want the close to be clear of the level by a few pips, since a close exactly at it is ambiguous.
Trading a BOS: worked example
This is an illustrative buy on EUR/USD, H1. Price breaks the high, pulls back to the broken level, and shows a bullish reaction. You buy the pullback, place the stop below the pullback low and target twice the risk.
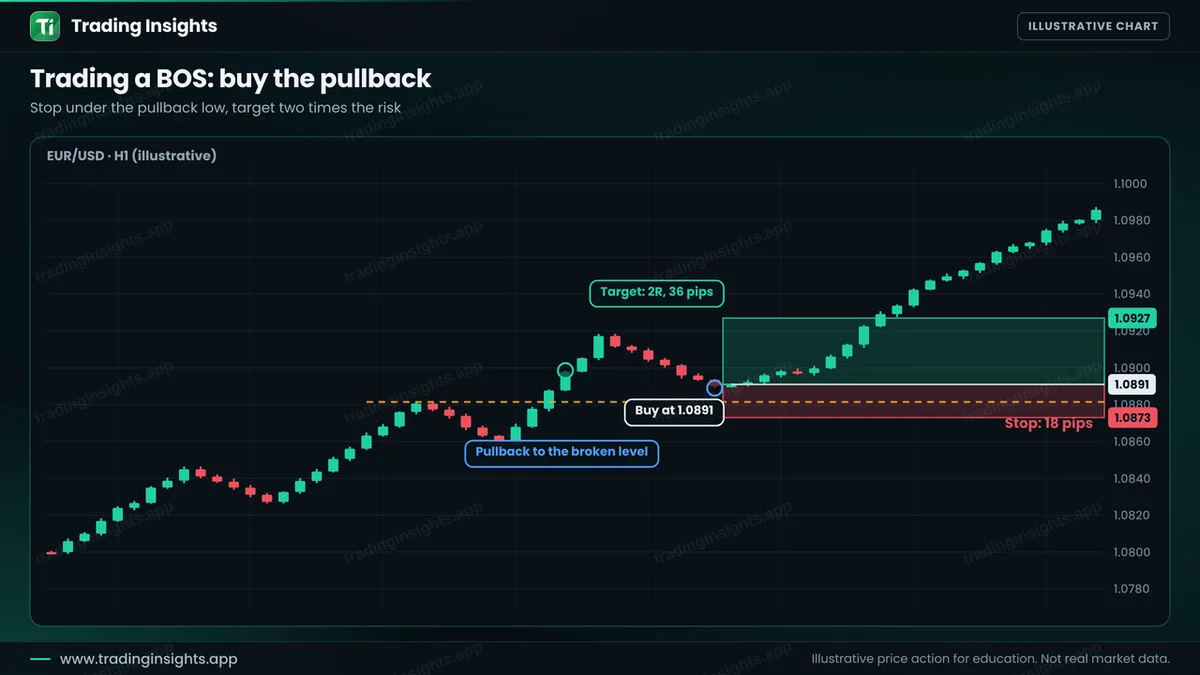
- Entry: 1.0891, at the broken level after a reaction.
- Stop loss: 1.0873, below the pullback low (18 pips).
- Take profit: 1.0927 (36 pips), a ratio of 1:2.


