
Where should a stop loss go? A fixed number, such as 10 pips, is easy to remember. But the market does not move the same amount every day. On a quiet day, 10 pips can be a large move. On a busy day, it can be normal noise. The Average True Range (ATR) helps you set a stop that follows the real movement of the market.
What ATR measures
ATR is an indicator that shows the average size of a candle over a number of periods, usually 14. It uses the true range, which is the largest of three numbers: the high minus the low of the candle, the high minus the previous close, or the previous close minus the low. The result is a single number in pips. It does not show direction. It only shows how much price tends to move in one candle.
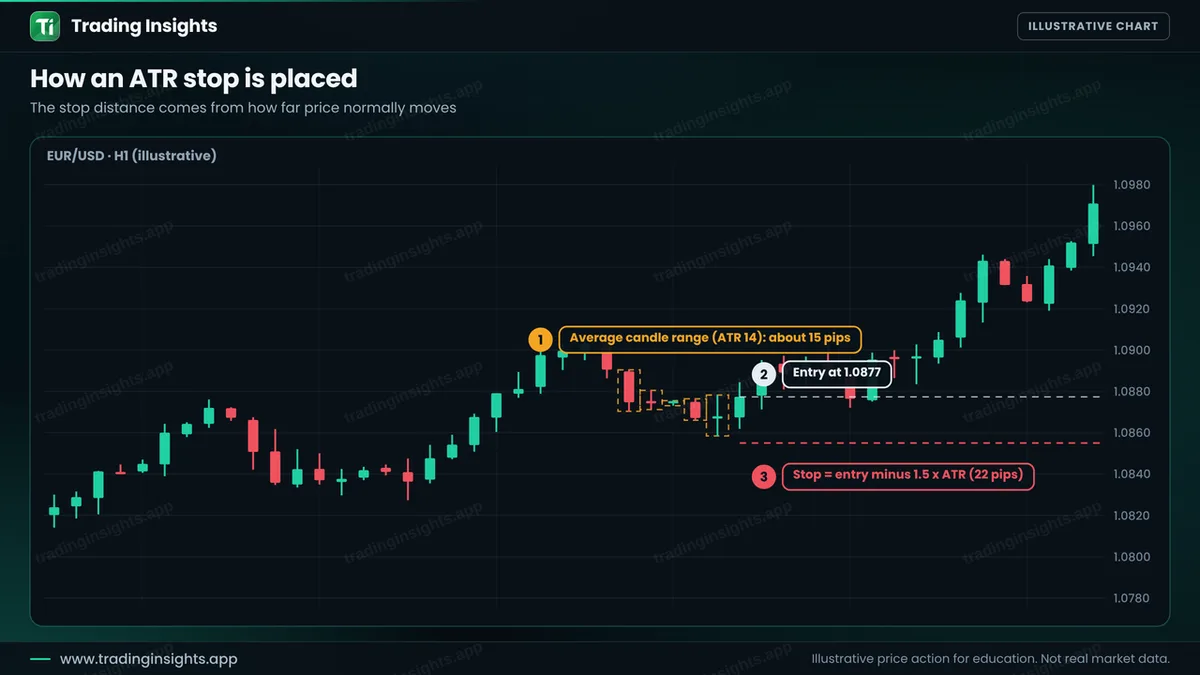
A high ATR means large candles and an active market. A low ATR means small candles and a quiet market. When you place a stop based on ATR, it automatically gets wider in an active market and tighter in a quiet one.
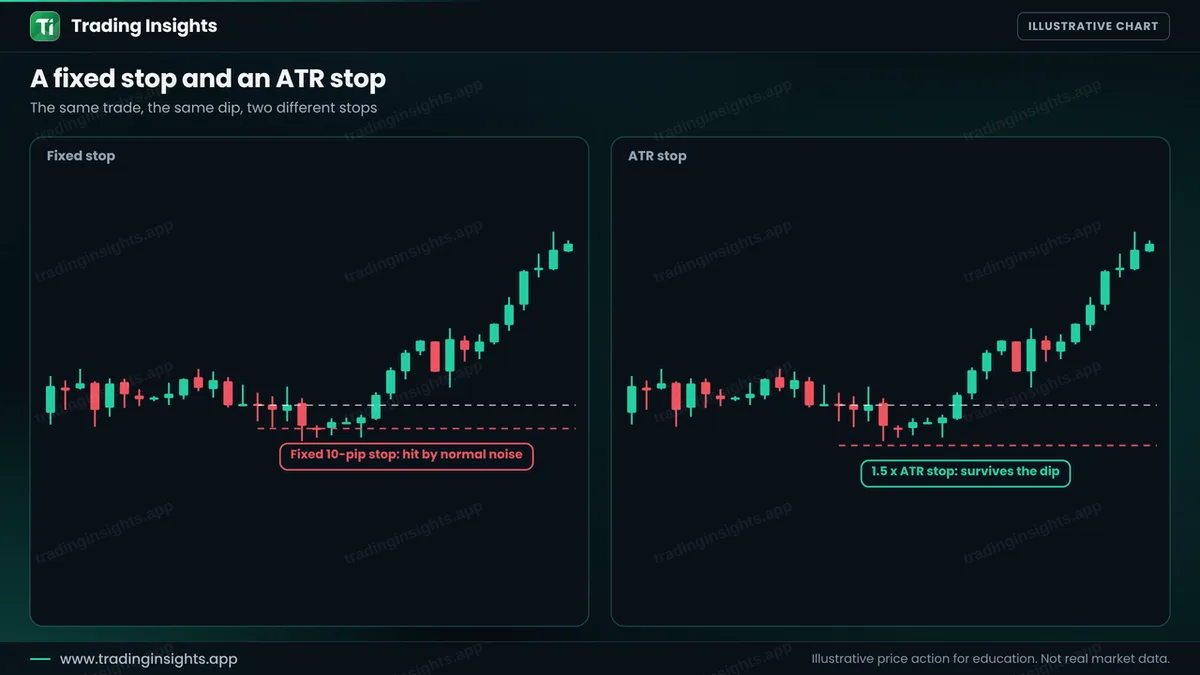
A fixed stop and an ATR stop
The picture shows the main benefit. A stop that is smaller than the normal movement gets hit by noise, even when your idea is right. An ATR stop gives price room to move without making the stop too large. Learn more about stops in stop loss and take profit.
The rules, step by step
- Add the ATR indicator with the period 14 to your chart.
- Read the value in pips at the time of your entry.
- Choose a multiplier. 1.5 or 2 times ATR is common. Test what works for your style.
- Place the stop. For a buy, entry minus the multiplier times ATR. For a sell, entry plus it.
- Check the structure. If a swing low is just beyond the ATR distance, you can place the stop below it instead.
- Size the position from the stop distance.
- Set the target at twice the risk, or the next level.
A worked trade
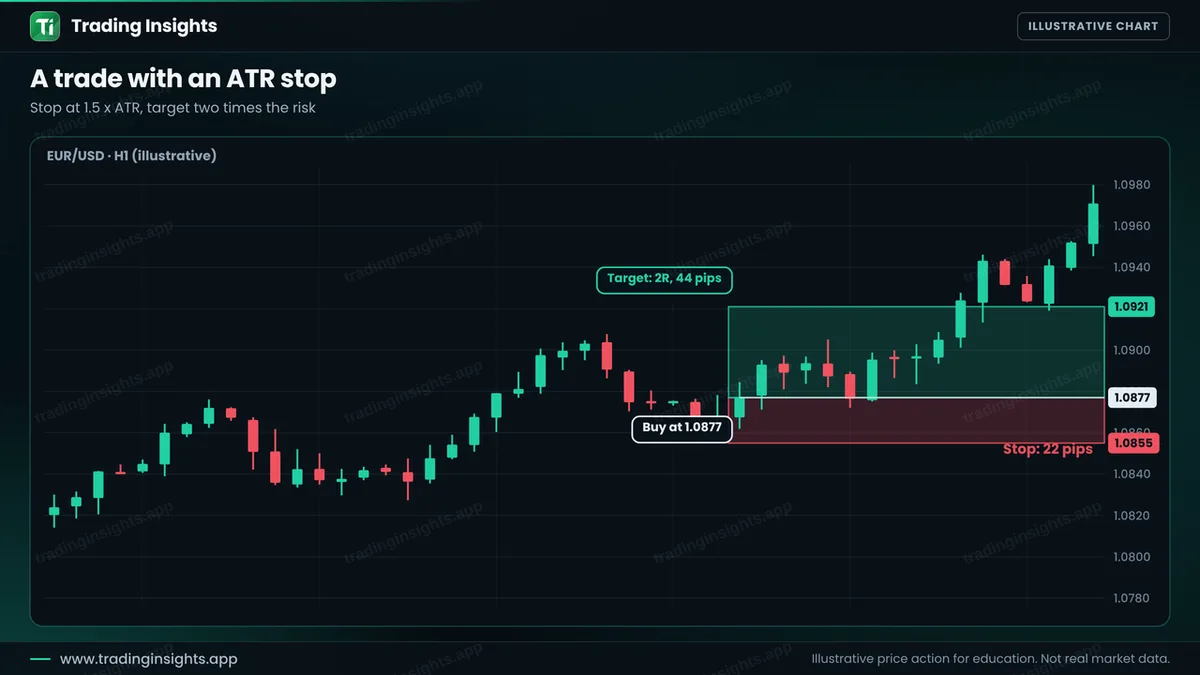
This is an illustrative buy on EUR/USD, H1. The ATR (14) is about 15 pips. You buy at 1.0877. The stop is 1.5 x ATR below, which is 22 pips, so it goes at 1.0855. The target at twice the risk is 44 pips higher at 1.0921.
- Entry: 1.0877.
- Stop loss: 1.0855, which is 1.5 x ATR (22 pips).
- Take profit: 1.0921 (44 pips), a ratio of 1:2.
With a $10,000 account risking 1% ($100), the position size is $100 / (22 pips x $10 per pip per lot) = about 0.45 lot. A win pays about $200, and a loss costs about $100. Notice how the stop distance feeds the position size. When ATR is high, the stop is wider, so the lot size gets smaller, and the money at risk stays the same. This is the real power of the method: the risk in money stays at 1%, whatever the volatility. Check the numbers with the position size calculator, and read how to calculate position size.
How to avoid the common failures
- Do not use ATR alone. It shows volatility, not where the market structure is.
- Use the same timeframe. The ATR of H1 is not the ATR of D1.
- Do not change the multiplier to fit. Choose it with tests, then keep it. See how to backtest.
- Watch for volatility spikes. A news candle raises ATR, and the stop becomes very wide for a while. See trading forex news.
- Combine with a target. Check that the target leaves a good ratio. See risk to reward ratio.
Common mistakes
- Using a fixed stop on every trade, whatever the volatility.
- Keeping the same lot size when the ATR stop gets wider.
- Using a multiplier below 1, which puts the stop inside the normal noise.
- Moving the stop away from the ATR level when price approaches it.
- Forgetting the spread on small stops.
Frequently asked questions
What is ATR in trading?
ATR is the Average True Range. It shows the average size of price movement over a number of candles, usually 14, and helps measure volatility.
Which ATR multiplier should I use?
Many traders use 1.5 to 2 times ATR for a stop. Test the multiplier for your pair, timeframe and strategy.
Does ATR show the direction of the trend?
No. It only shows how much price moves, not whether it goes up or down.
Can I use ATR for the take profit?
Yes. Some traders use a multiple of ATR as a target, but you should still check the nearby support and resistance levels.
Trading involves risk. This is education, not financial advice. The charts are illustrative and not real market data. Trading carries risk, and no method guarantees results.


