
A trend line connects a series of highs in a downtrend or lows in an uptrend. As long as price respects the line, the trend continues. When price finally closes beyond the line, the trend may be changing. The trend line break strategy aims to trade that change, and it does so with a safer entry: it waits for the break, and then for a retest of the line.
What a trend line break looks like
Take a downtrend. Price makes lower highs, and you can draw a line through at least two of them, and ideally three. The line acts as a ceiling. At some point a candle closes above the line. This is the break. Often, price then returns to the line from above, touches it, and bounces. This is the retest. The old ceiling has become a floor.
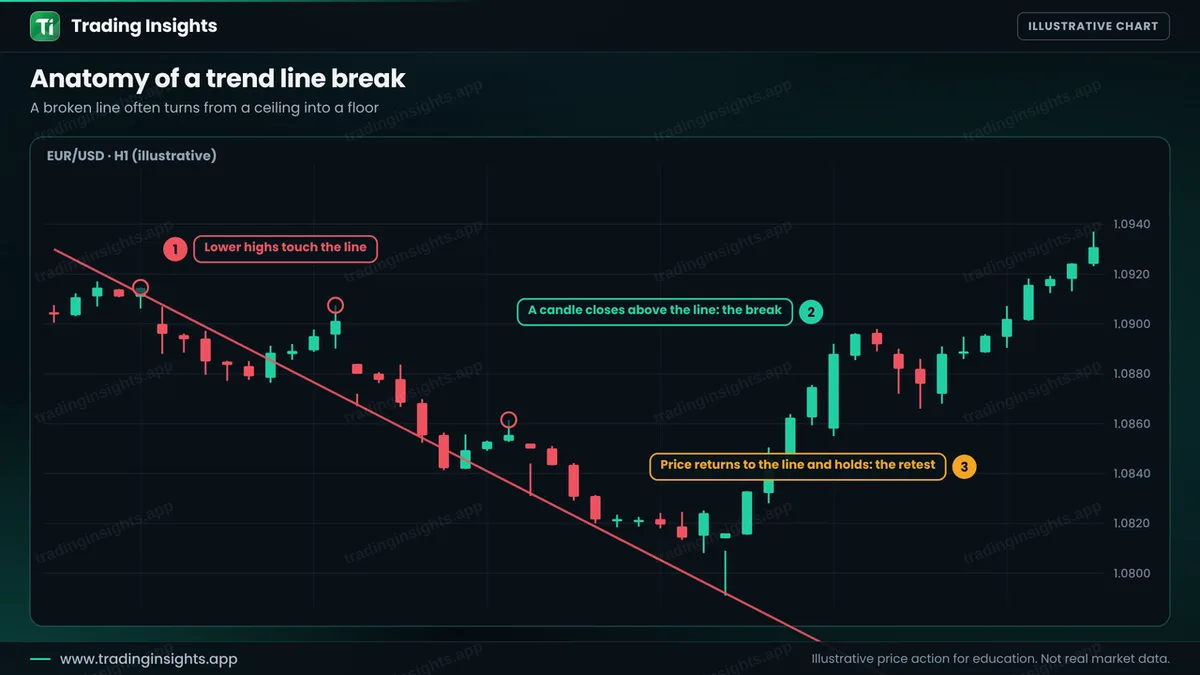
This is the same idea as in break and retest, but with a sloping line instead of a flat level. For how to draw lines, see trend lines and channels.
A real break and a fake one
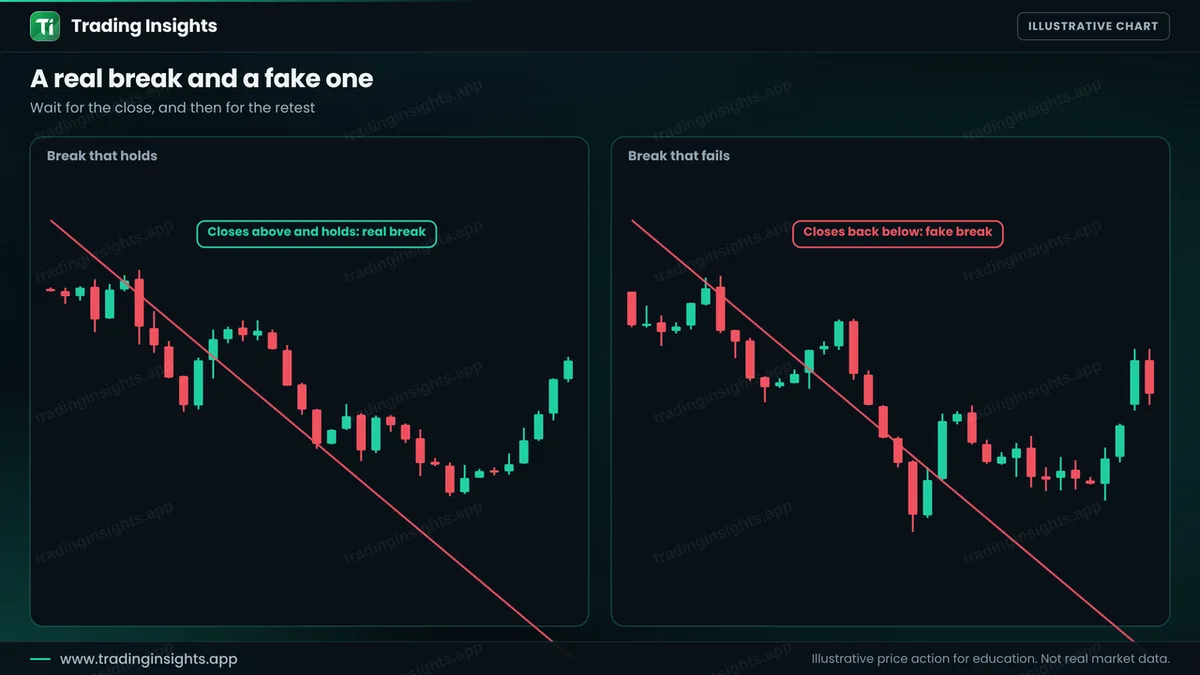
In a real break, price closes beyond the line and stays there. In a fake break, price closes beyond the line for a moment and then returns, and the old trend goes on. You cannot know in advance. The retest helps, because it gives you extra time to see if the line really holds from the other side.
The rules, step by step
- Draw a valid line. At least two touches, ideally three, with no candles cutting through it.
- Wait for a close beyond the line. A wick does not count.
- Wait for the retest. Price comes back to the line and holds on the new side.
- Look for a trigger. A bullish candle that closes after the retest, such as a pin bar or an engulfing candle.
- Place the stop. Below the low of the retest, with a small buffer.
- Set the target. Twice the risk, or the next resistance level.
A worked trade
This is an illustrative buy on EUR/USD, H1. A downtrend line runs through three lower highs. A strong candle closes above it, and later price pulls back to the old line and holds. A bullish candle closes at 1.0888. You buy there, place the stop below the retest low at 1.0863, and target twice the risk, which is 1.0938.
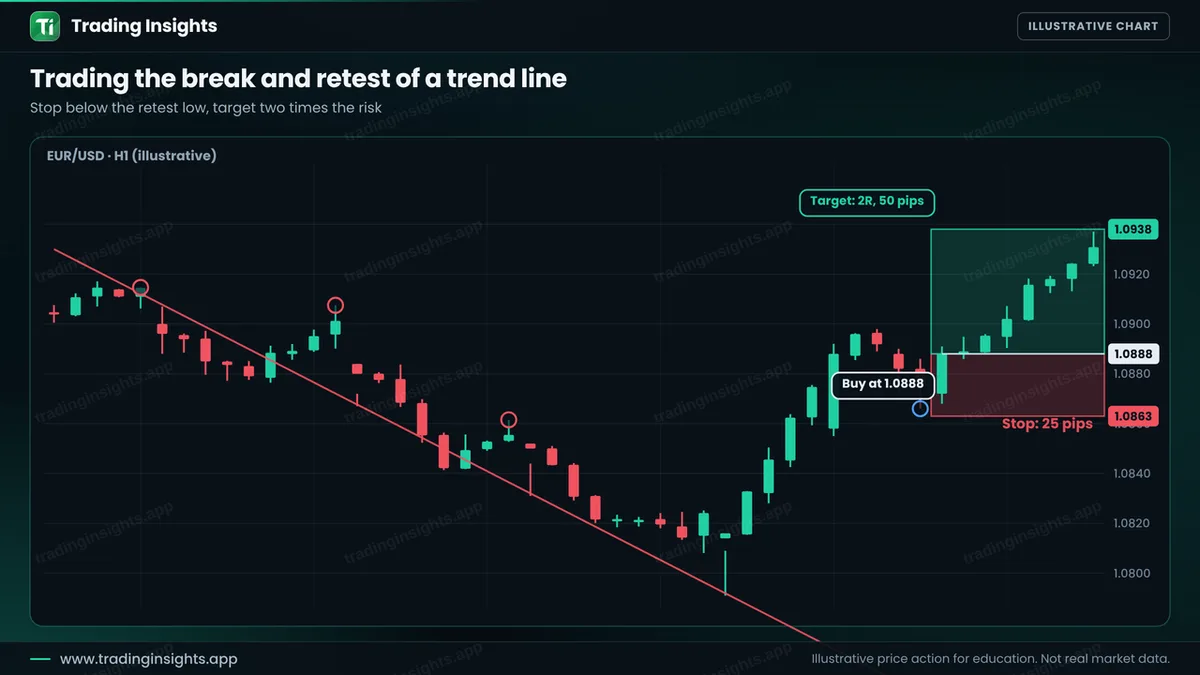
- Entry: 1.0888, after the bullish candle at the retest.
- Stop loss: 1.0863, below the retest low (25 pips).
- Take profit: 1.0938 (50 pips), a ratio of 1:2.
With a $10,000 account risking 1% ($100), the position size is $100 / (25 pips x $10 per pip per lot) = about 0.40 lot. A win pays about $200, and a loss costs about $100. Check your own numbers with the position size calculator.
How to avoid the common failures
- Do not draw lines to fit. If you must adjust the line many times, it is not valid.
- Prefer a clear break. A strong close beyond the line is better than a weak one.
- Look for a change in structure. A break of the line together with a higher high confirms more. See change of character.
- Do not wait forever. Sometimes price does not retest and runs away. Skip it. There will be another trade.
- Test it. Test 50 or more breaks. See how to backtest.
Common mistakes
- Entering as soon as the line is touched, with no close beyond it.
- Using a line with only two touches on a tiny timeframe.
- Putting the stop above the line instead of below the retest low.
- Chasing the break after a long run, with no retest.
- Forgetting that the line is only a guide and can fail.
Frequently asked questions
What does a trend line break mean?
It means that price closed beyond the line that had held the trend. It can be a warning of a change in direction.
Should I enter on the break or the retest?
Entering on the retest usually gives a better price and a smaller stop, but you may miss trades that never retest. Some traders enter on the break with smaller size.
How many touches make a valid trend line?
Two touches draw the line, and a third confirms it. More touches make it stronger, but old lines can weaken.
Does a break always lead to a reversal?
No. Sometimes the break only leads to a range, or the trend resumes. A stop loss protects you.
Trading involves risk. This is education, not financial advice. The charts are illustrative and not real market data. Trading carries risk, and no method guarantees results.


