
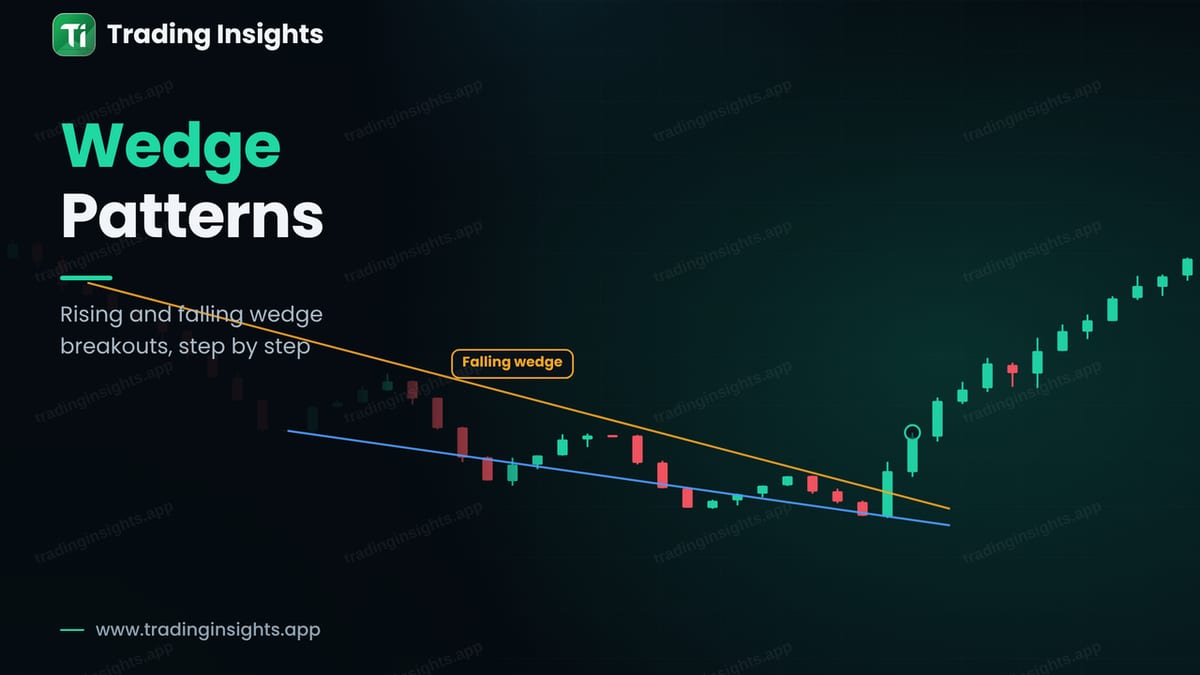
A wedge is a chart pattern where price moves between two trendlines that slope in the same direction but come closer together. Both lines point up in a rising wedge, and both point down in a falling wedge. The narrowing shape shows that the move is losing strength, and that is why wedges often end with a break in the opposite direction.
What a falling wedge looks like
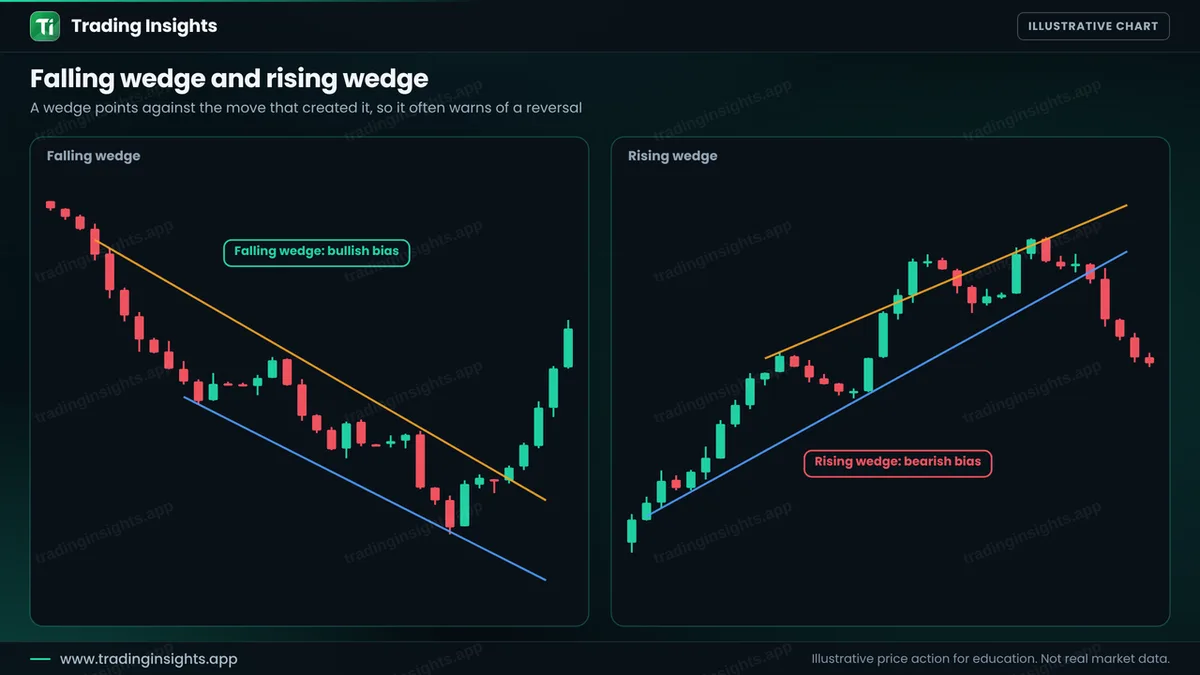
In a falling wedge, price makes lower highs and lower lows, but the lows fall more slowly than the highs. The upper line slopes down steeply and the lower line slopes down gently, so the lines converge. Sellers are still in control, but each new push down achieves less. When price finally closes above the upper line, buyers often take over.
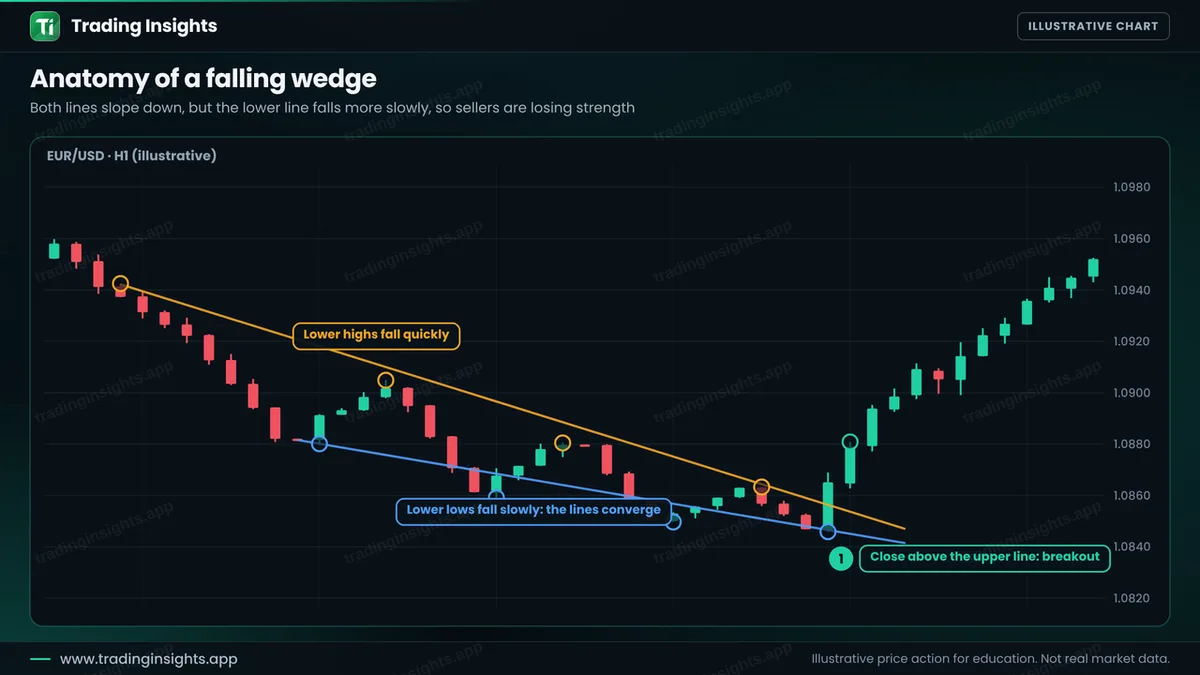
The logic is simple. A downtrend that makes smaller and smaller progress is running out of sellers. The pattern does not prove a reversal, but it shows that the pressure is fading, and the breakout gives you a clear point to act.
Rising and falling wedges side by side
The rising wedge is the mirror image. Price makes higher highs and higher lows, but the highs rise more slowly than the lows, so the lines converge. Buyers push up, yet each push is smaller. A close below the lower line suggests that sellers are taking over. In both cases the wedge points against the move that created it, so it often warns of a reversal.
The rules, step by step
- Find a clear wedge. Two lines with at least two touches each, both sloping the same way and converging. If the lines are parallel, it is a channel, not a wedge.
- Look at the context. A falling wedge after a decline, or a rising wedge after a rise, is the typical setup. A wedge inside a strong trend can also act as a pause and then continue.
- Wait for the breakout close. The candle must close outside the line. A wick through the line is not enough.
- Place the stop. For a falling wedge, below the last low of the wedge with a small buffer. For a rising wedge, above the last high.
- Set the target. A common method is to aim for the start of the wedge, where the pattern began. Some traders take part of the profit earlier.
- Size the trade. Use the stop distance and a fixed risk. See position sizing.
A worked trade
This is an illustrative buy on EUR/USD, H1. A falling wedge forms after a decline. A candle closes above the upper line at 1.0865. You buy there, place the stop below the last wedge low at 1.0843, and target the start of the wedge at 1.0939.
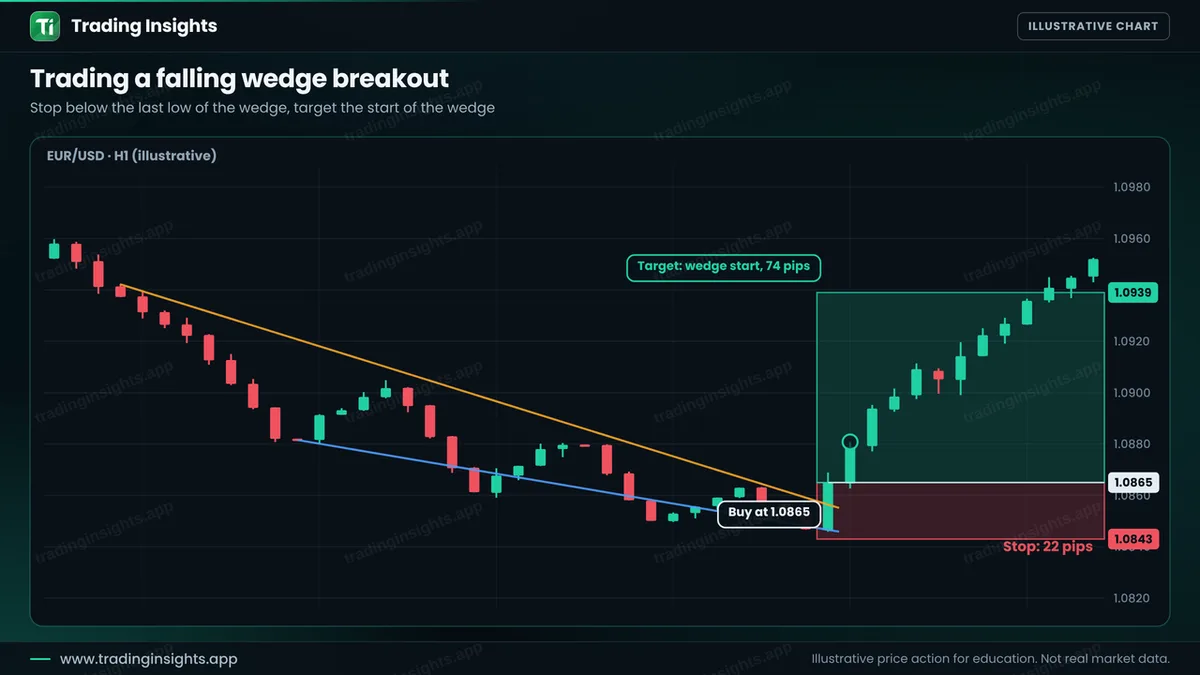
- Entry: 1.0865, after the close above the upper line.
- Stop loss: 1.0843, below the last low of the wedge (22 pips).
- Take profit: 1.0939 (74 pips), a ratio of about 1:3.4.
With a $10,000 account risking 1% ($100), the position size is $100 / (22 pips x $10 per pip per lot) = about 0.45 lot. A win pays about $330, and a loss costs about $100. Check your own numbers with the risk reward calculator. Because the wedge is narrow, the stop is tight, and that is what makes the ratio attractive. It also means that a small spike can stop you out, so use a sensible buffer.
How to avoid the common failures
- Do not trade the middle. Wait for the close outside the line. Trading inside the wedge means guessing the direction.
- Beware of a fake break. Price can close outside the wedge and then return. See false breakouts.
- Check the higher timeframe. A falling wedge against a strong downtrend on the daily chart has less support. See top-down analysis.
- Test it. Mark at least 50 wedges on past charts and record the results. See how to backtest a forex trading strategy.
Common mistakes
- Drawing lines that force a wedge onto random price action.
- Entering before the breakout candle closes.
- Putting the stop inside the wedge where normal noise reaches it.
- Assuming every wedge ends in a reversal.
- Ignoring a breakout in the direction of the original trend.
Frequently asked questions
What is a falling wedge?
It is a pattern with two downward sloping lines that converge, where the lower line falls more slowly. It often ends with an upward breakout.
Is a rising wedge bullish or bearish?
It usually has a bearish bias, because buyers make less progress with each push. A close below the lower line is the signal.
What is the difference between a wedge and a triangle?
A triangle has one flat line or lines that slope in opposite directions. A wedge has two lines that slope the same way. See triangle patterns.
Do wedges always reverse the trend?
No. Sometimes a wedge is only a pause, and price continues. That is why you wait for the close and use a stop loss.
Trading involves risk. This is education, not financial advice. The charts are illustrative and not real market data. Trading carries risk, and no method guarantees results.


