
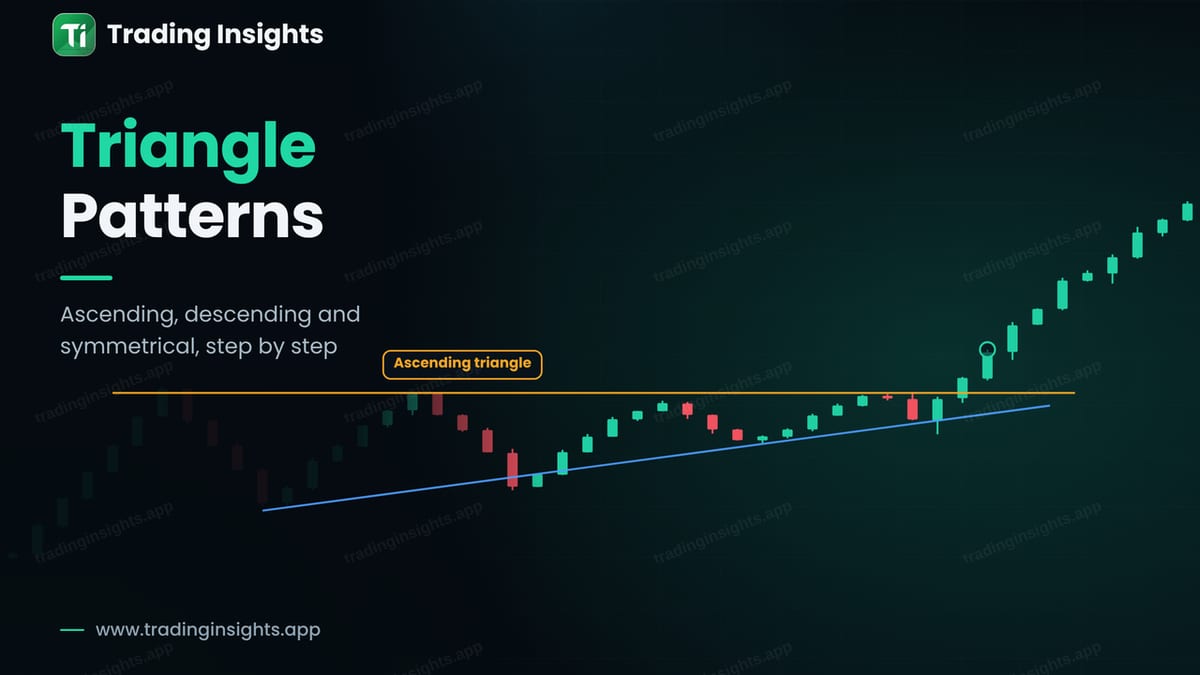
A triangle forms when price moves in a tighter and tighter range, so that the highs and the lows converge toward each other. The squeeze shows that the market is building energy, and a breakout often follows. There are three common types: the ascending triangle, the descending triangle and the symmetrical triangle. Each one has a typical bias, but none of them is a guarantee. This guide explains how to recognise each type, how to trade the breakout, and a worked example with a stop loss, a target and a lot size.
The ascending triangle
An ascending triangle has a flat resistance line on top and a rising support line below. Price tests the same resistance several times, but each pullback is shallower, so the lows are higher. Buyers are getting more aggressive while sellers defend one level. The usual idea is a break upward through the resistance.
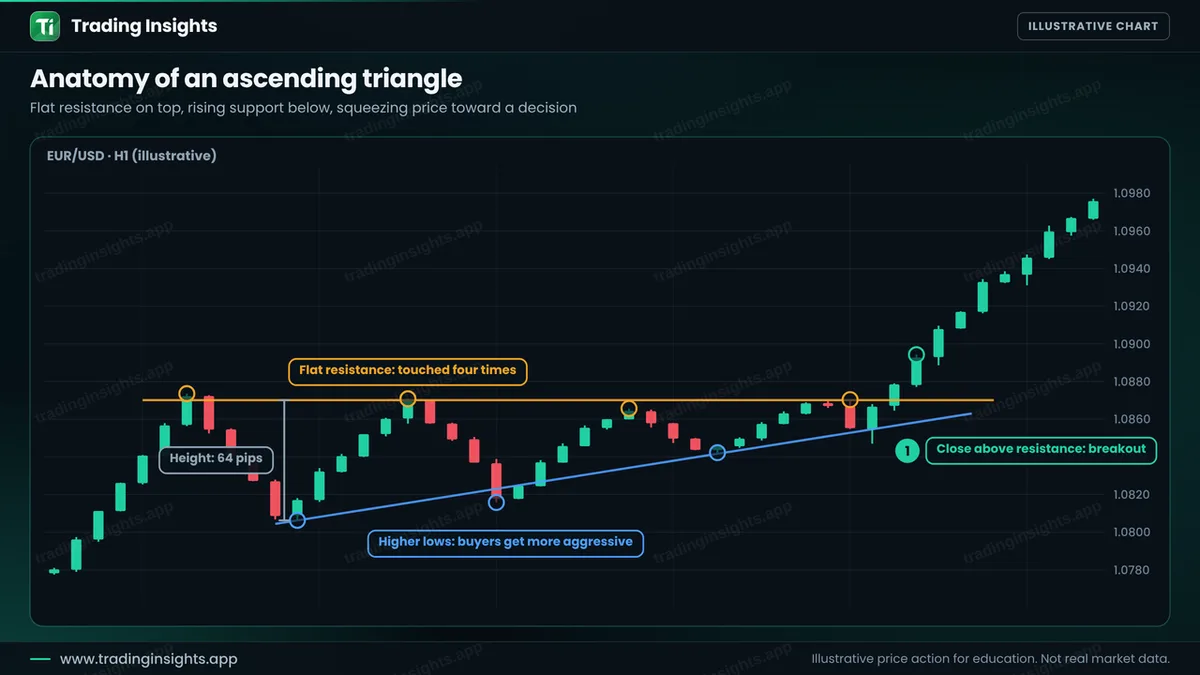
The height of the triangle is measured at its widest part, from the first low to the resistance. Here it is 64 pips. This height is later used as a target. For the levels themselves see support and resistance vs supply and demand zones.
Three types at a glance
- Ascending: flat top, rising lows. Bullish bias, especially in an uptrend.
- Descending: flat bottom, falling highs. Bearish bias, especially in a downtrend.
- Symmetrical: falling highs and rising lows. No bias of its own, so you wait for the break and look at the trend before it.
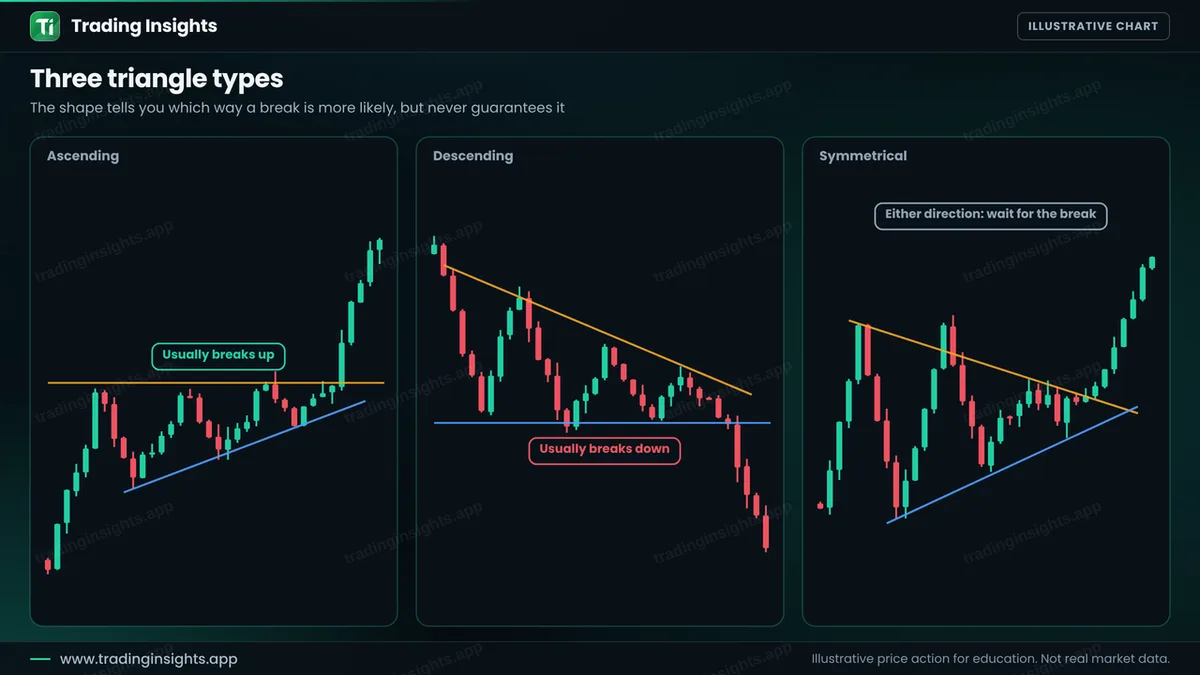
The bias is only a tendency. A triangle often breaks in the direction of the trend that came before it, and sometimes it breaks the other way. This is why you trade the breakout and not the shape.
The rules, step by step
- Find at least two touches on each line. Four touches in total are the minimum, and more is better.
- Check the trend before the triangle. It helps you judge which break is more likely.
- Wait for a close beyond a line. A wick is not a breakout. See break of structure for the same rule.
- Place the stop. For an ascending triangle break, below the last higher low with a small buffer.
- Set the target. The height of the triangle added to the breakout level.
- Be careful with late breaks. If price has already moved most of the way to the apex, the signal is weaker.
A worked trade
This is an illustrative buy on EUR/USD, H1. Price breaks above the resistance, and the candle closes at 1.0878. You buy at the close, place the stop below the last higher low at 1.0839, and target the triangle height (64 pips) above the resistance, at 1.0942.
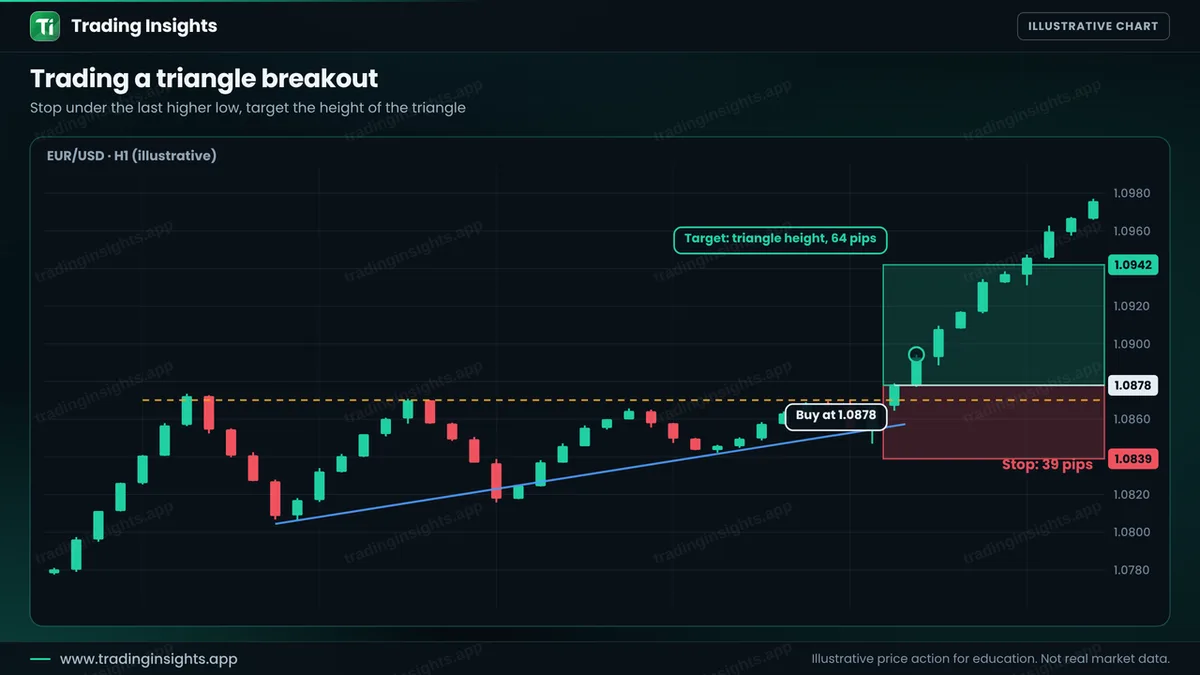
- Entry: 1.0878, after the close above the resistance.
- Stop loss: 1.0839, below the last higher low (39 pips).
- Take profit: 1.0942 (64 pips), a ratio of about 1:1.6.
With a $10,000 account risking 1% ($100), the size is $100 / (39 pips x $10 per pip per lot) = about 0.26 lot. A win pays about $165, and a loss costs about $100. A ratio of 1:1.6 is acceptable but not large, so some traders wait for a retest of the broken line to get a closer stop. See break and retest. Check the numbers with the risk-reward calculator.
Common mistakes
- Drawing lines through a few points that do not really line up.
- Buying inside the triangle before the break.
- Assuming the bias is certain.
- Using the wick of a candle as the breakout.
- Entering very late, near the apex, with a wide stop.
Frequently asked questions
Which triangle is the most reliable?
There is no most reliable one. Ascending and descending triangles have a bias, but each can fail. Test the pattern on your own charts.
How do I draw a triangle correctly?
Connect at least two swing highs and two swing lows with straight lines. If you have to force the lines through candle bodies, it is probably not a clean triangle.
What is the target of a triangle breakout?
A common method is to add the height of the triangle at its widest part to the breakout level.
Can a triangle break in the opposite direction?
Yes. This is why you wait for a close beyond a line and use a stop loss.
Trading involves risk. This is education, not financial advice. The charts are illustrative and not real market data. Trading carries risk, and no method guarantees results.


