
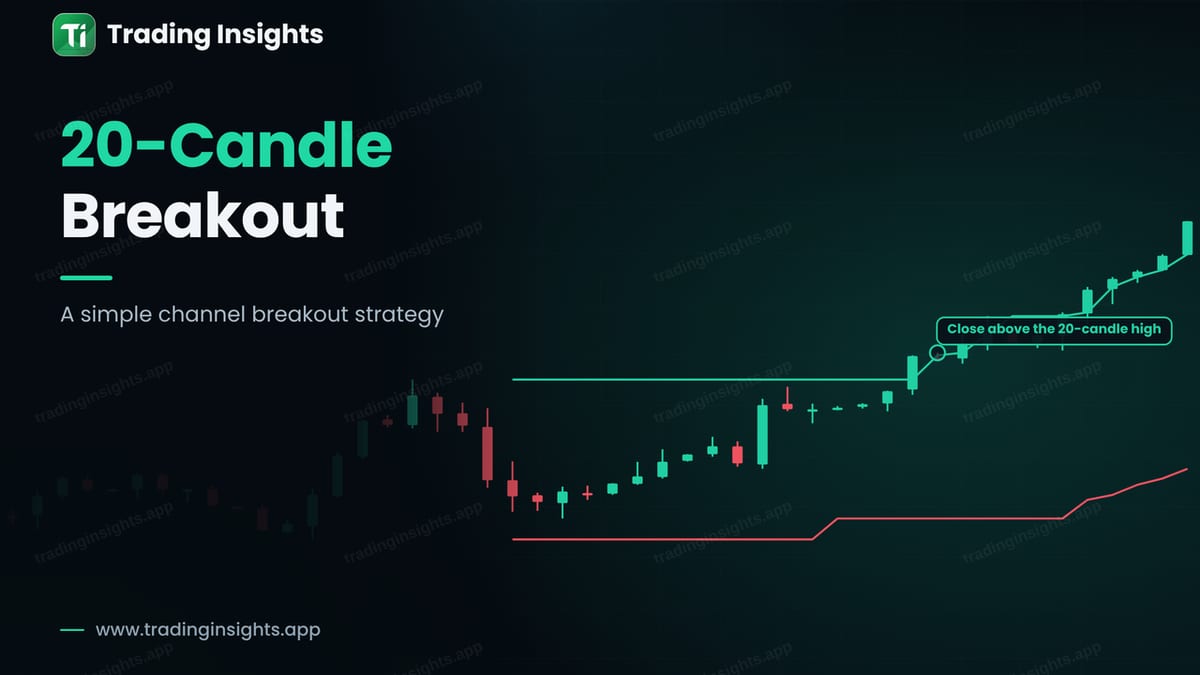
A channel breakout strategy is a simple trend-following idea. You draw a line at the highest high of the last 20 candles, and another at the lowest low. When price closes above the upper line, it has broken out of its recent range, and the strategy buys. When price closes below the lower line, it sells. The tool is known as a Donchian channel, and it has been used by trend followers for decades.
What the 20-candle channel looks like
For each candle, the upper line is the highest high of the previous 20 candles, and the lower line is the lowest low of the same period. The lines move as the candles move. In a quiet range, the lines stay flat. When price pushes beyond the upper line, the market is making a new 20-candle high, which means that buyers have won the recent fight.
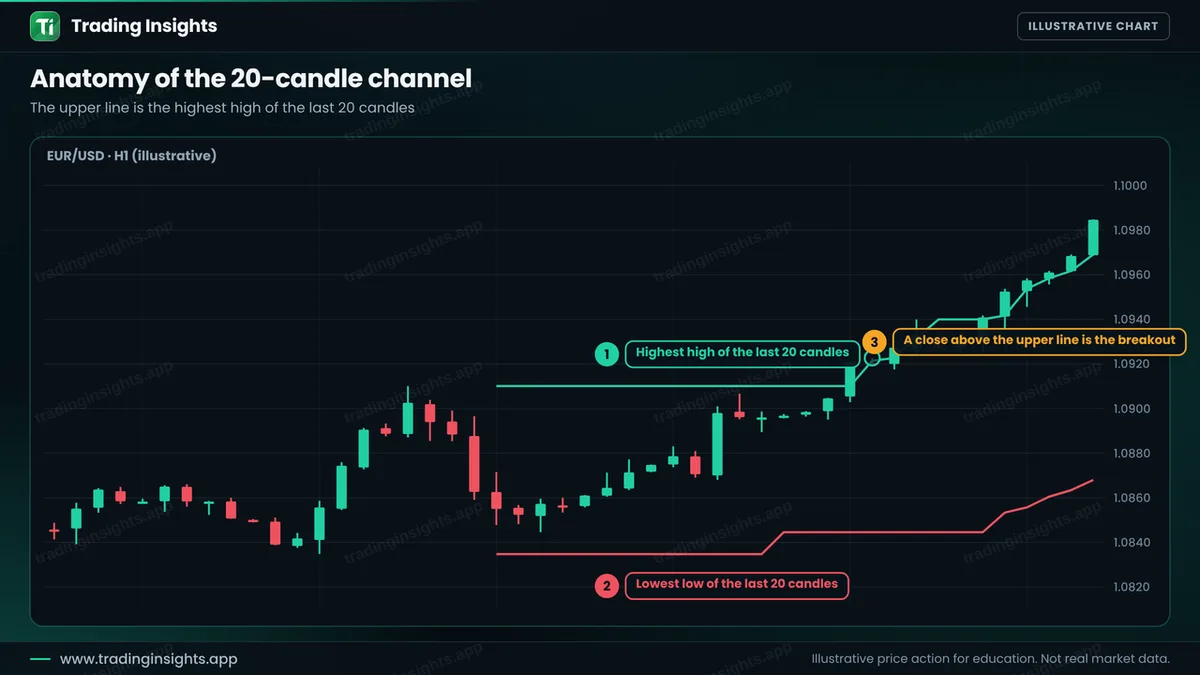
The number 20 is not magic. A shorter period gives more signals and more noise. A longer period gives fewer and slower signals. On the H1 chart, 20 candles is almost one trading day, which makes the channel easy to understand.
Breakouts that hold and breakouts that fail
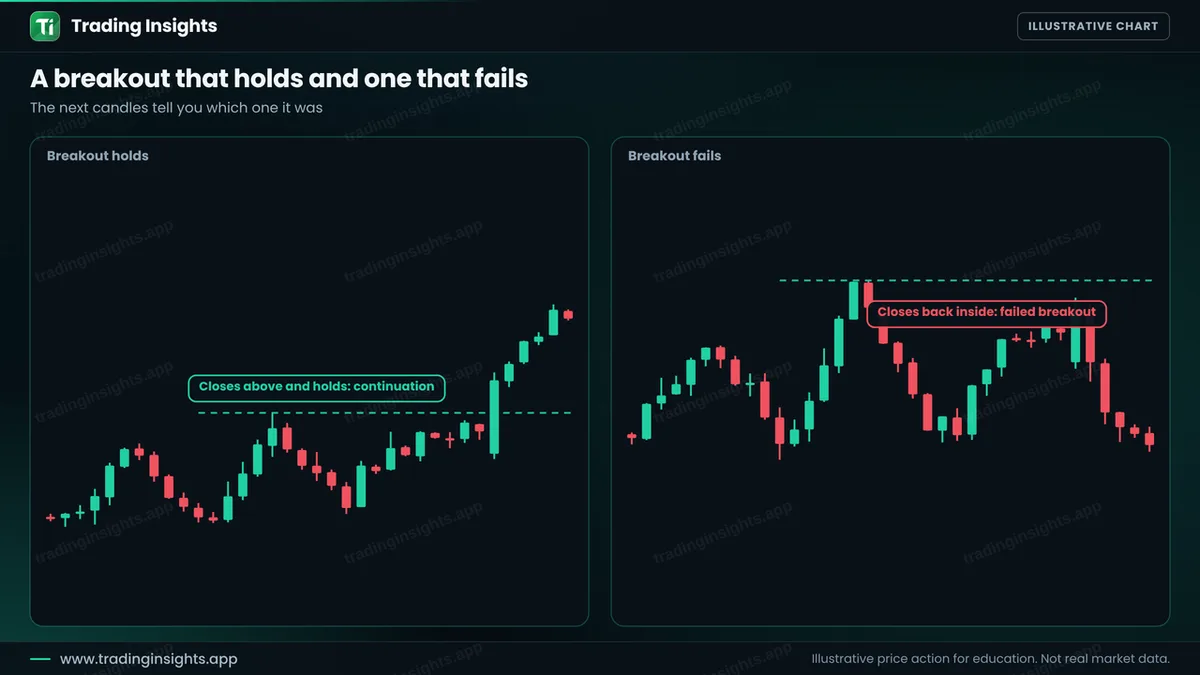
Not every breakout works. Some close above the line, then fall back inside and head the other way. This is a false breakout. See false breakouts for the full idea. You cannot avoid all of them, so the strategy accepts small losses and aims for large trends, which is the nature of trend following.
The rules, step by step
- Add the channel. Use a Donchian channel with a period of 20, or mark the highest high and lowest low by hand.
- Wait for a close. A candle must close above the upper line for a buy, or below the lower line for a sell. A wick is not enough.
- Prefer a quiet start. A breakout after a tight, quiet range tends to be cleaner than one after a big move.
- Enter after the close. At the close of the breakout candle, or at the open of the next one.
- Place the stop. Below the low of the breakout candle with a small buffer. A more careful option is the middle of the channel, which gives a wider stop.
- Set the target. Twice the risk is a common choice. Or trail the stop under the previous candles and let a trend run.
A worked trade
This is an illustrative buy on EUR/USD, H1. Price has moved in a range for 20 candles. A strong candle closes above the upper line at 1.0921. You buy there, place the stop below the breakout candle low at 1.0900, and target twice the risk, which is 1.0963.
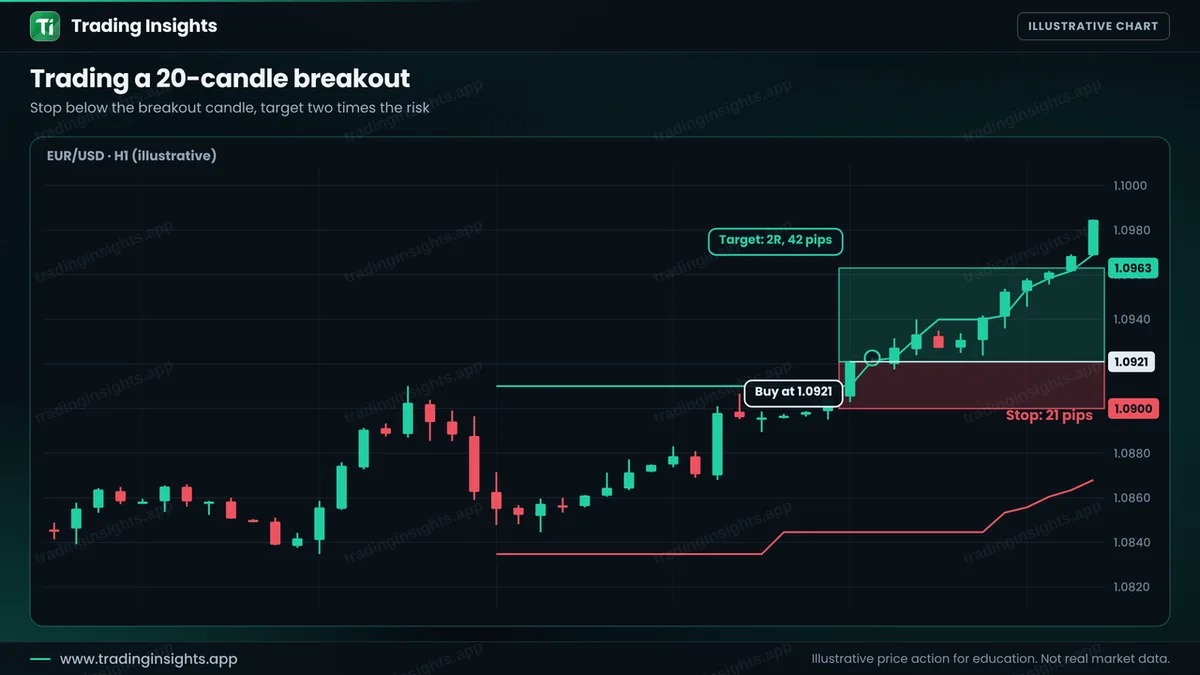
- Entry: 1.0921, after the close above the channel.
- Stop loss: 1.0900, below the breakout candle (21 pips).
- Take profit: 1.0963 (42 pips), a ratio of 1:2.
With a $10,000 account risking 1% ($100), the position size is $100 / (21 pips x $10 per pip per lot) = about 0.48 lot. A win pays about $200, and a loss costs about $100. Check your own numbers with the position size calculator.
How to avoid the common failures
- Do not trade in the middle. Act only on a close beyond the line.
- Check the bigger picture. A buy breakout in a higher-timeframe uptrend has more support. See top-down analysis.
- Avoid news. Spikes can create false breakouts. See trading forex news.
- Accept a low win rate. Many breakouts fail, but the winners should be larger than the losers.
- Test it. Test on at least 50 to 100 breakouts. See how to backtest.
Common mistakes
- Entering on a wick through the line.
- Using the strategy in a tight, choppy market with many false signals.
- Placing the stop inside the channel noise.
- Taking profit too early on a trending move.
- Changing the period after every loss.
Frequently asked questions
What is a 20-candle breakout?
It is a signal that appears when price closes above the highest high, or below the lowest low, of the last 20 candles.
Is it the same as a Donchian channel?
Yes. A Donchian channel plots the highest high and lowest low over a set period, and the 20-candle breakout is a trade based on it.
What timeframe works best?
Any timeframe can work. H1 and H4 give fewer signals than M5 and are easier to follow.
Why do breakouts fail so often?
Many ranges are only pauses, and some moves lack follow-through. A trend-following strategy accepts many small losses for a few large gains.
Trading involves risk. This is education, not financial advice. The charts are illustrative and not real market data. Trading carries risk, and no method guarantees results.


