
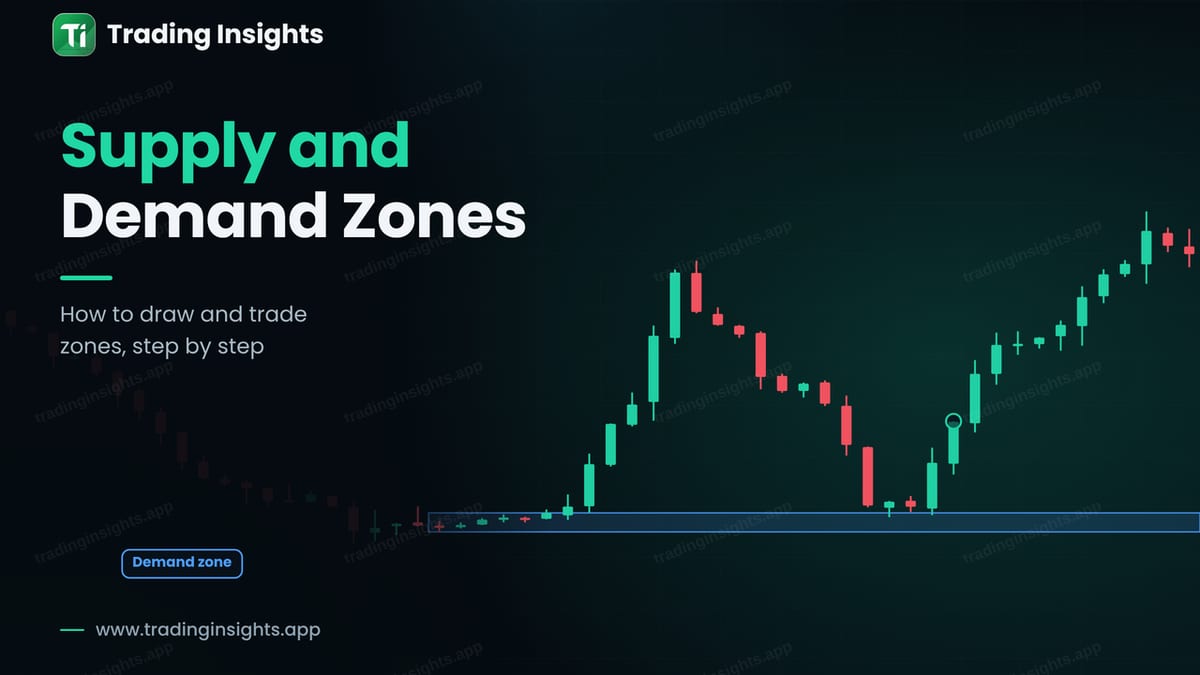
Supply and demand trading looks for areas where price made a strong move away after a short pause. The idea is that unfilled orders may remain in that area. When price returns to the zone, those orders can push it away again. A demand zone sits below the market and is used for buys. A supply zone sits above the market and is used for sells.
What a demand zone looks like
A demand zone has two parts. The base is a small area where price pauses, with small candles in a tight space. The departure is a strong move up from the base, with large candles. Later, when price comes back down to the base, buyers may step in again.
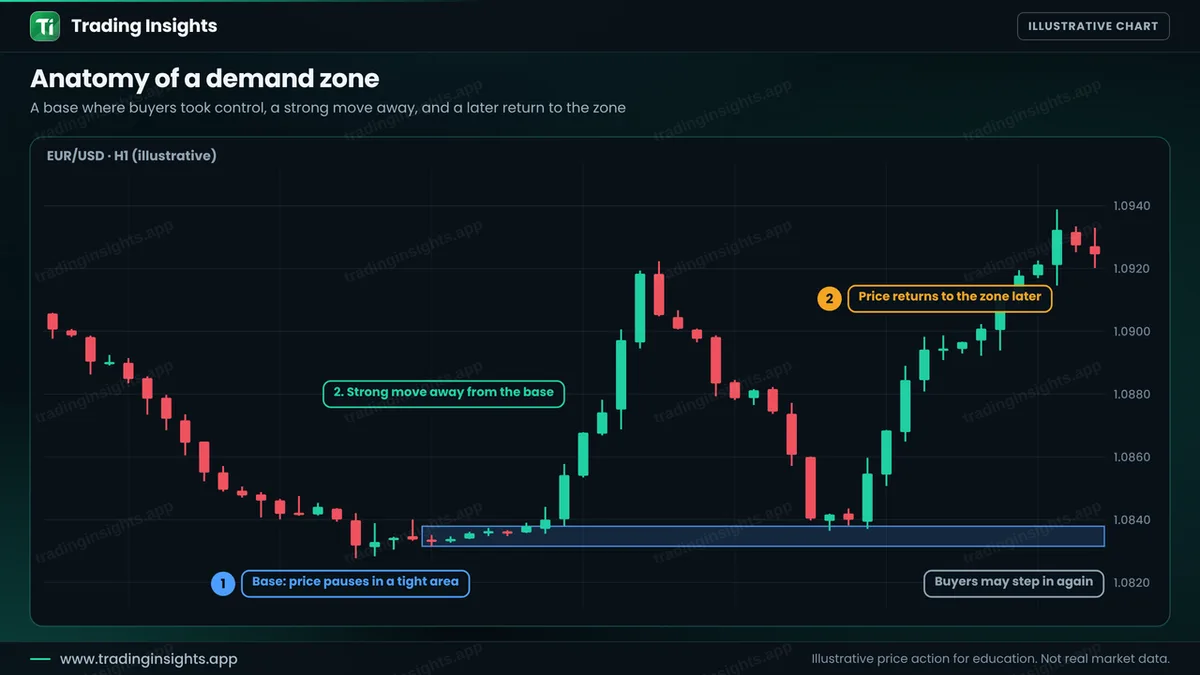
A supply zone is the mirror image. It forms at the top, where price pauses and then falls sharply. Sellers may step in when price rises back into it. How is this different from ordinary support and resistance? A zone is an area, not a line, and it is drawn from the base before a strong move. For a comparison, see support and resistance vs supply and demand zones.
How to draw the zone
- Find a strong move. Look for large candles that leave an area quickly.
- Mark the base. Find the small candles just before the move.
- Draw the box. The top and bottom of the base, including the wicks if you want a wider zone.
- Extend it to the right. Wait for price to return.
Four checks before you trade a zone
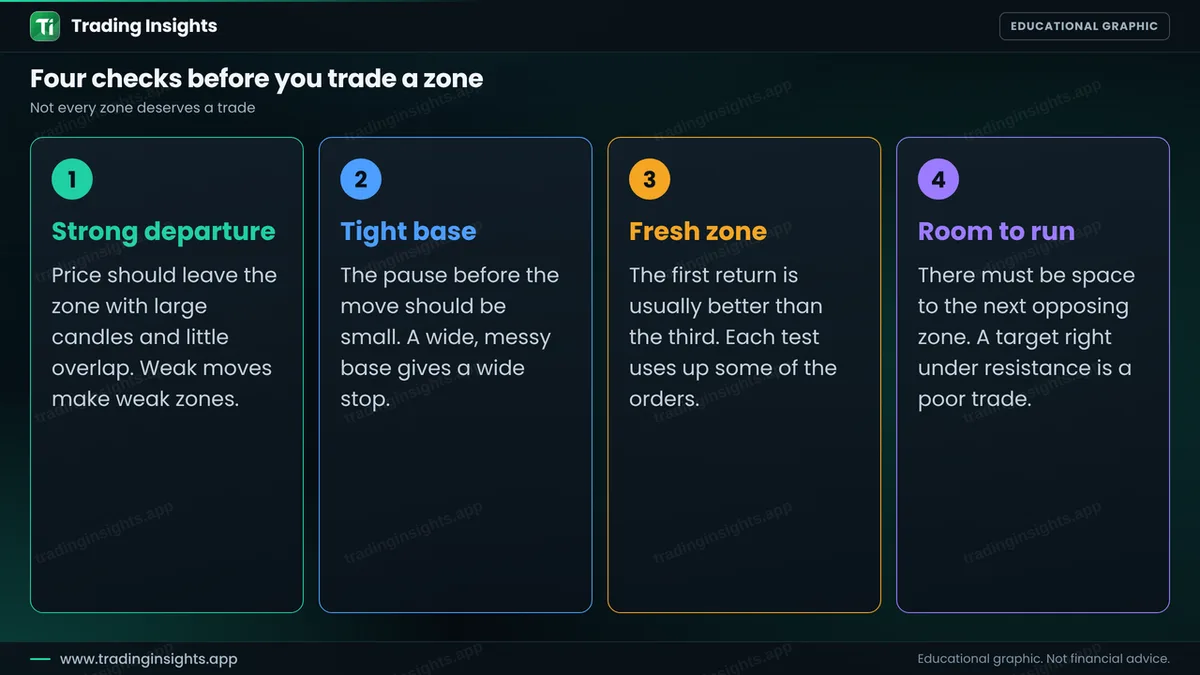
- Strong departure. Price should leave with large candles and little overlap. A weak move makes a weak zone.
- Tight base. A small base gives a small stop. A wide, messy base gives a wide stop and a poor ratio.
- Fresh zone. The first return is usually better than the third. Each test uses up some of the orders.
- Room to run. There must be space to the next opposing zone. A target right under resistance is a poor trade.
A worked trade
This is an illustrative buy on EUR/USD, H1. A tight base forms, and price rallies strongly. Later, price returns to the zone, and a bullish candle forms. You buy at 1.0855, place the stop below the zone at 1.0829, and target the previous swing high at 1.0922.
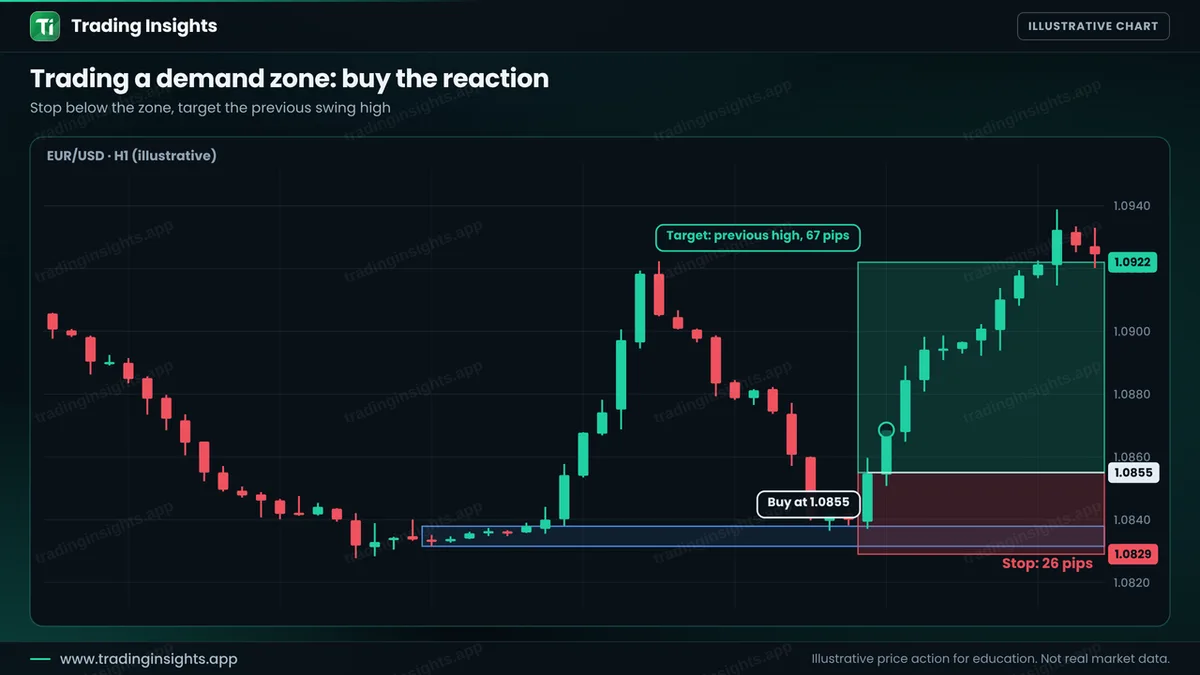
- Entry: 1.0855, after a bullish reaction candle at the zone.
- Stop loss: 1.0829, below the zone (26 pips).
- Take profit: 1.0922 (67 pips), a ratio of about 1:2.6.
With a $10,000 account risking 1% ($100), the position size is $100 / (26 pips x $10 per pip per lot) = about 0.38 lot. A win pays about $260, and a loss costs about $100. Check your own numbers with the position size calculator. For more on stops and targets, see stop loss and take profit.
How to avoid the common failures
- Wait for a reaction. Do not buy only because price touched the zone. Wait for a bullish candle. See candlestick patterns.
- Trade with the higher timeframe. A demand zone in a higher-timeframe uptrend has more support.
- Prefer discount areas. Buys from the lower half of a range are usually better. See premium and discount zones.
- Test it. Mark at least 50 zones on past charts and record the results.
Common mistakes
- Drawing zones on every small pause.
- Using wide, messy zones and then needing a huge stop.
- Trading a zone that has been tested many times.
- Entering with no confirmation.
- Ignoring the next opposing zone when setting the target.
Frequently asked questions
What is a demand zone?
It is an area where price paused and then rose sharply, which suggests that buyers were active there. Traders watch it for buys when price returns.
What is the difference between supply and demand zones?
A demand zone is below the market and is used for buys. A supply zone is above the market and is used for sells.
How many times can a zone be traded?
The first return is usually the best. Each test can use up orders, so zones that have been tested several times are weaker.
Do zones always hold?
No. A zone can fail, and price can close through it. That is why the stop goes beyond the zone.
Trading involves risk. This is education, not financial advice. The charts are illustrative and not real market data. Trading carries risk, and no method guarantees results.


