Practical, step-by-step strategies and market insight from our trading desk — written to be read, tested on a demo account, then applied with live signals in the app.
 Forex Basics
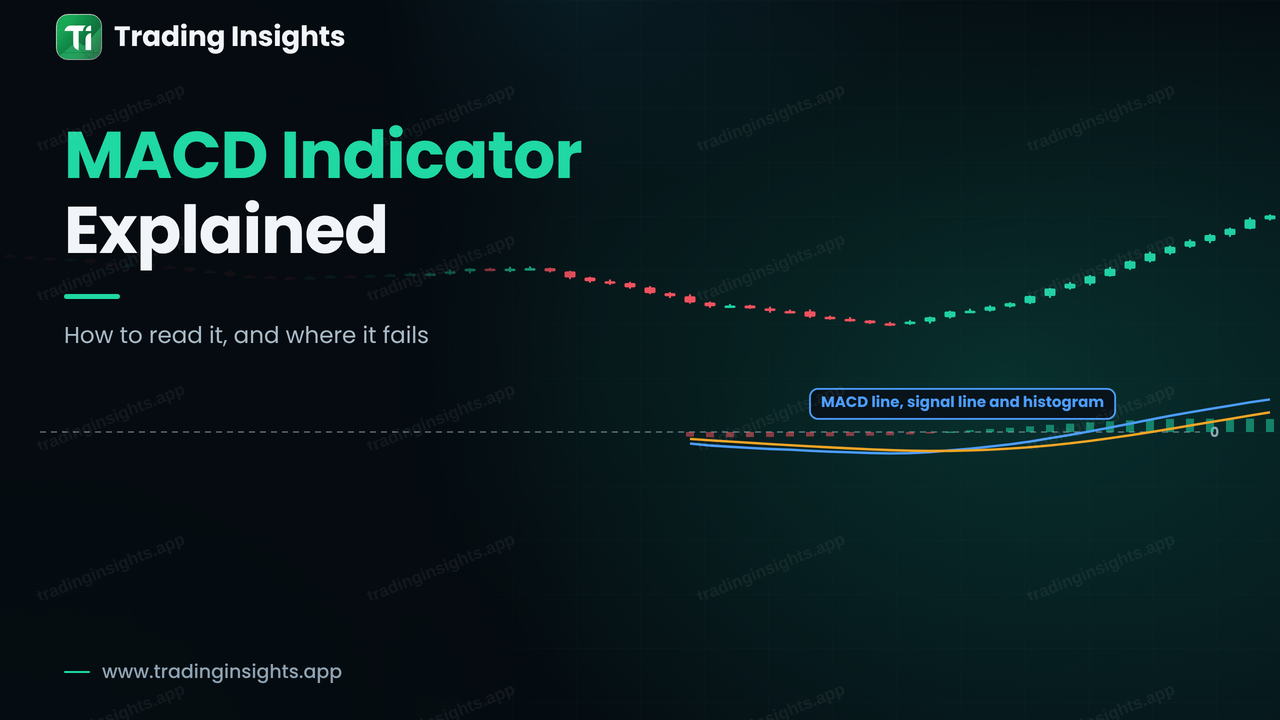
The MACD shows the momentum of a trend using two moving averages. Learn the 12, 26, 9 settings, how crossovers, the zero line and divergence work, and why the MACD gives false signals in ranges.
Read more →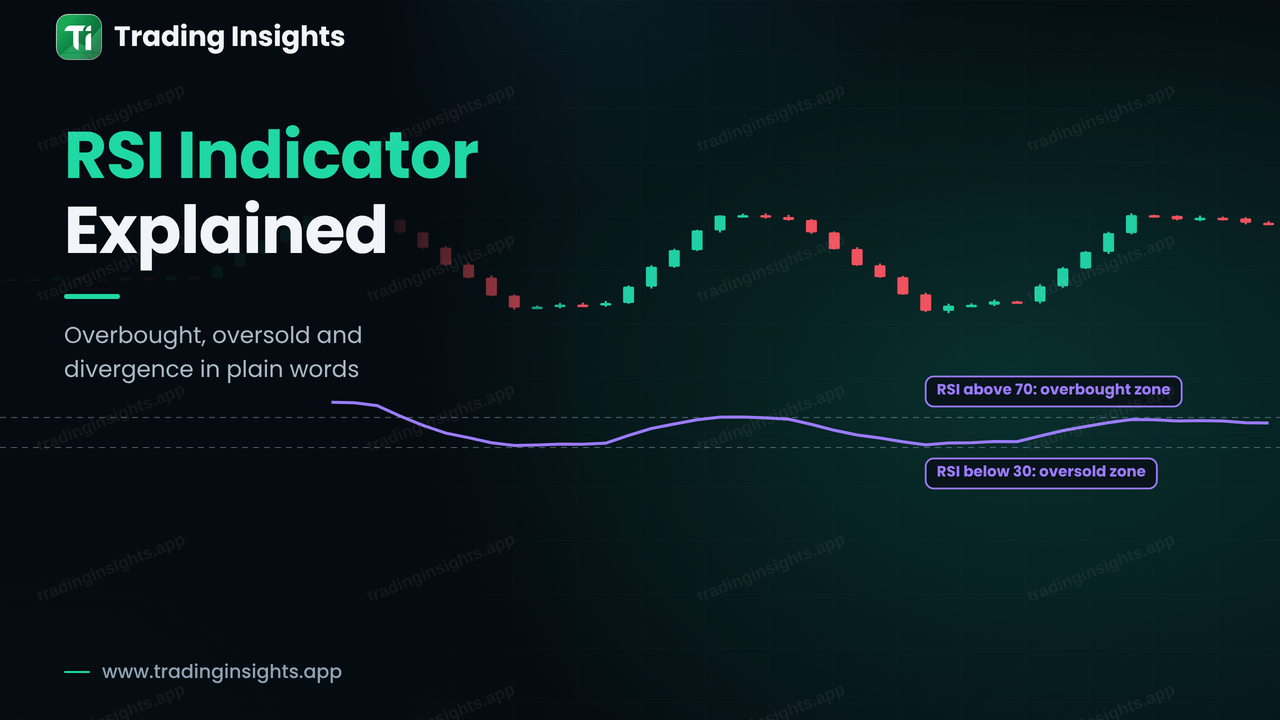 Forex Basics
The RSI measures the speed of recent price moves on a scale from 0 to 100. Learn what overbought and oversold really mean, how to spot divergence and how to avoid the most common RSI mistakes.
Read more →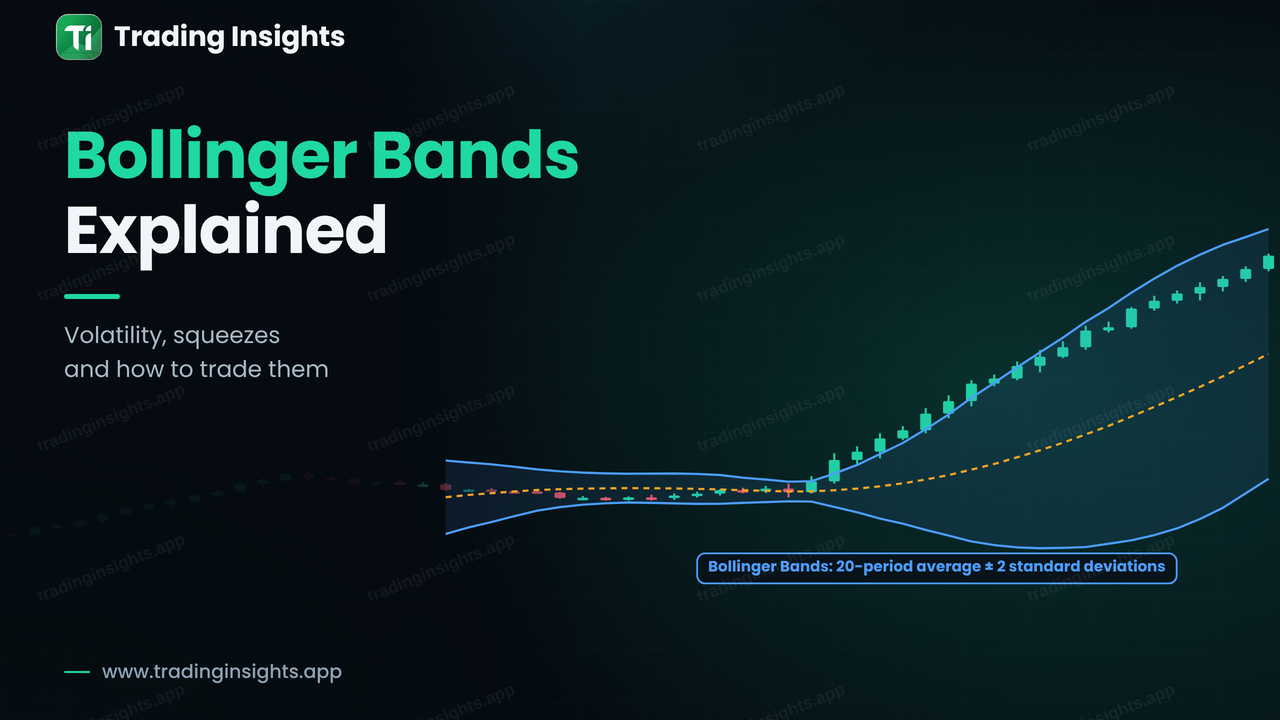 Forex Basics
Bollinger Bands show how volatile the market is and where price sits compared with its recent average. Learn the settings, the squeeze, the band walk and a worked breakout trade.
Read more →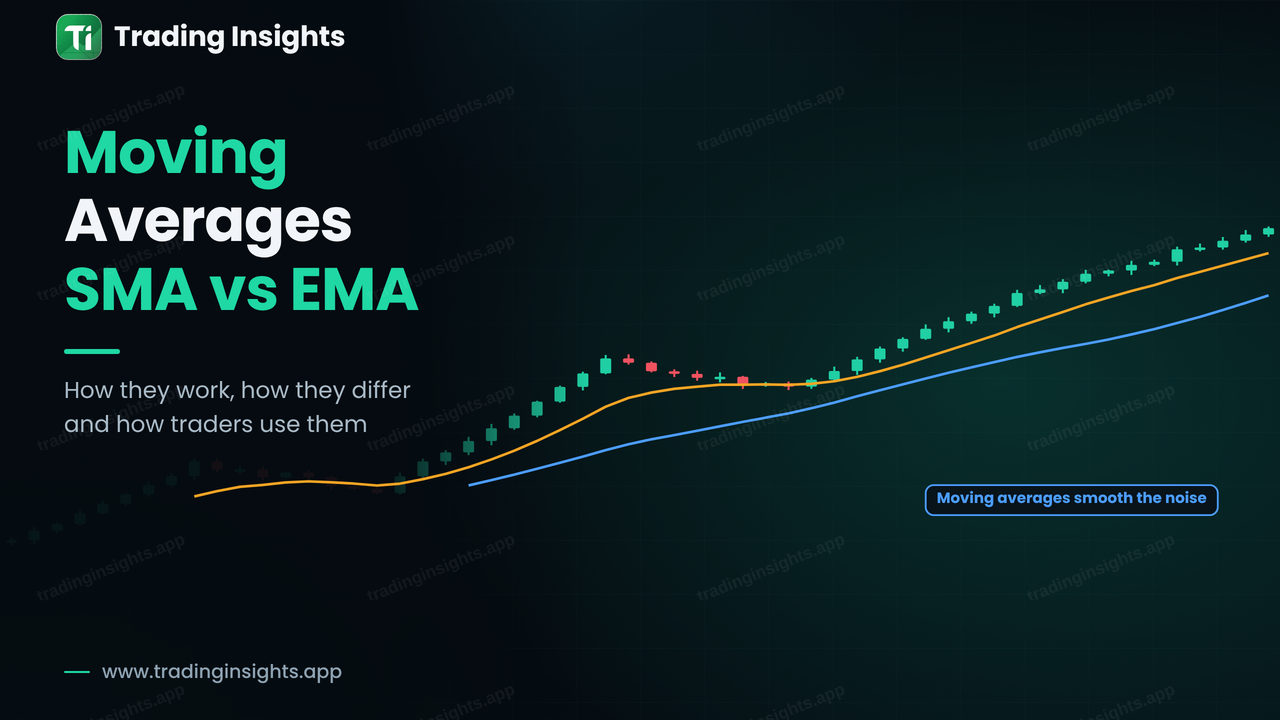 Forex Basics
A moving average smooths out price so the trend is easier to see. Learn how the SMA and EMA are calculated, how they differ, how crossovers work and how to plan a pullback trade.
Read more →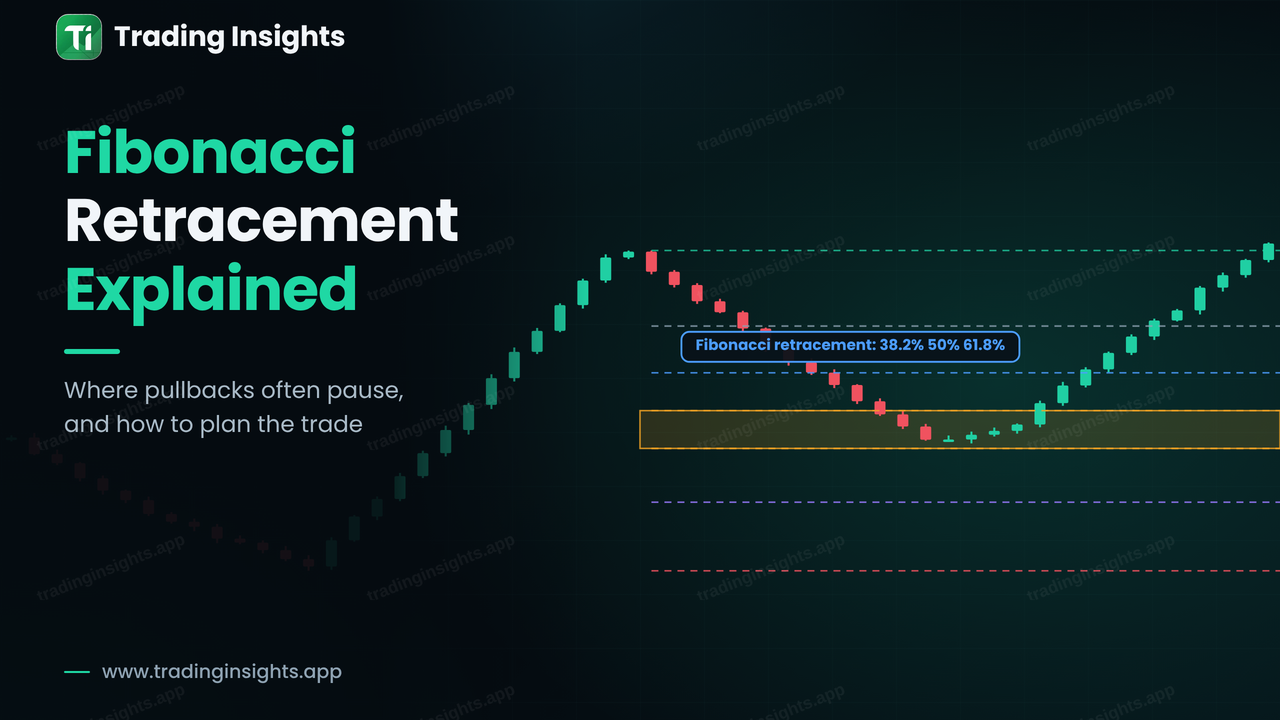 Price Action
Fibonacci retracement levels show how deep a pullback has gone inside a trend. Learn how to draw them, what the main levels mean and how to plan a pullback trade with a defined stop and target.
Read more →Signals are free on the website. Get the Trading Insights app for instant push alerts, the MT4/MT5 auto-execution EA and a live results dashboard.
