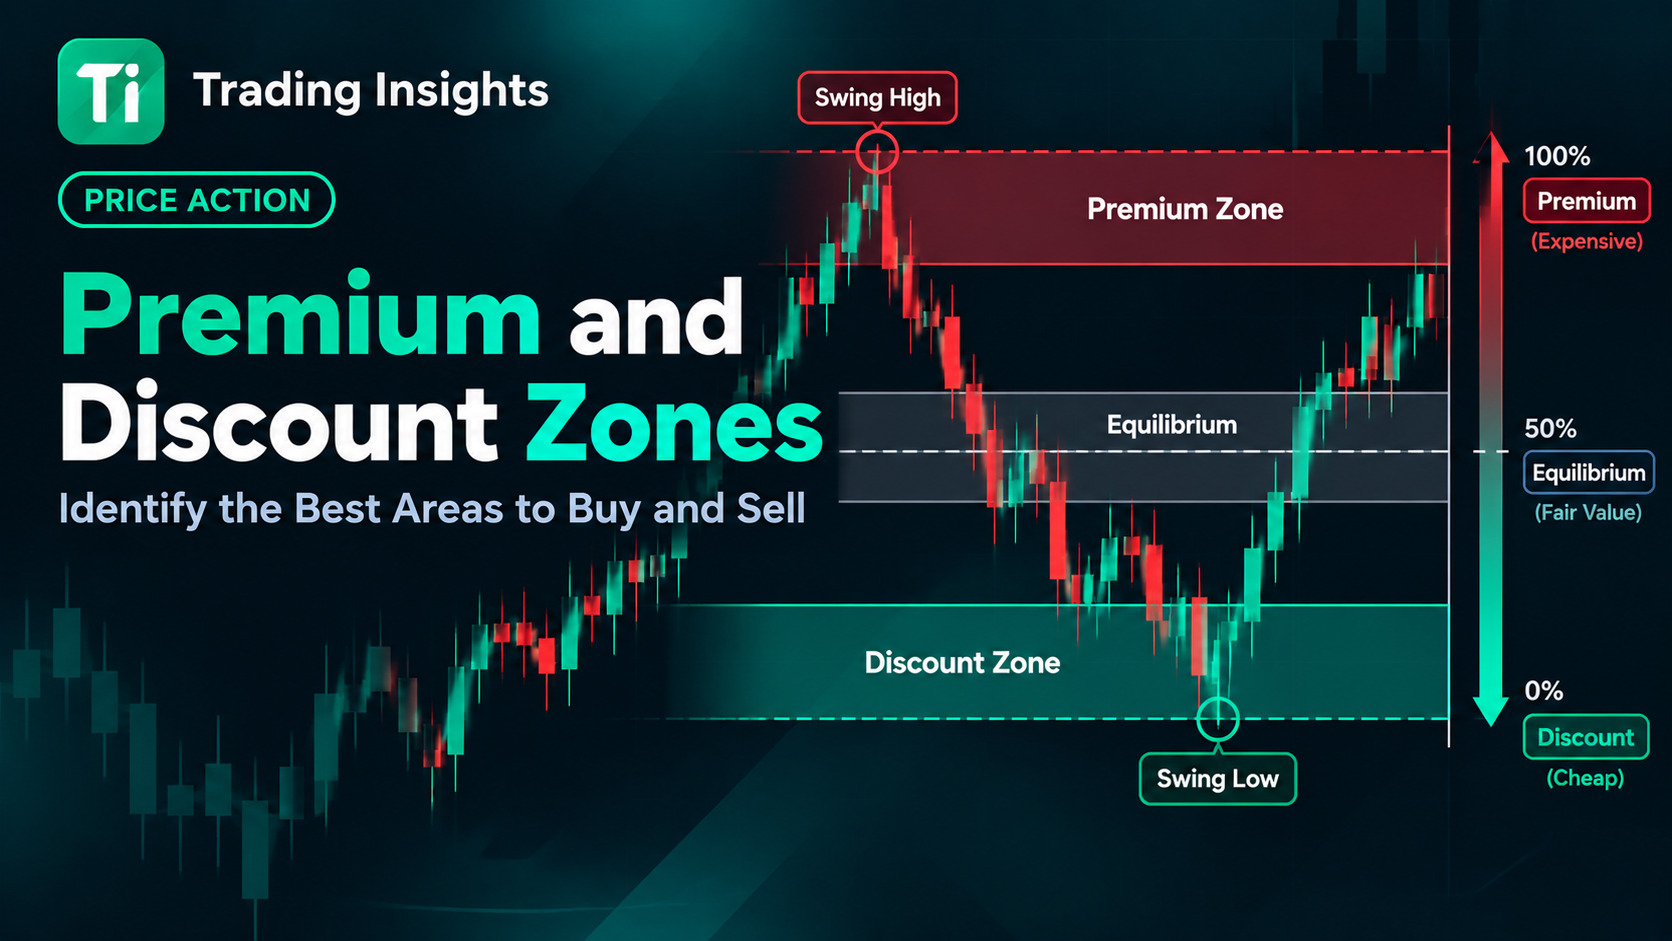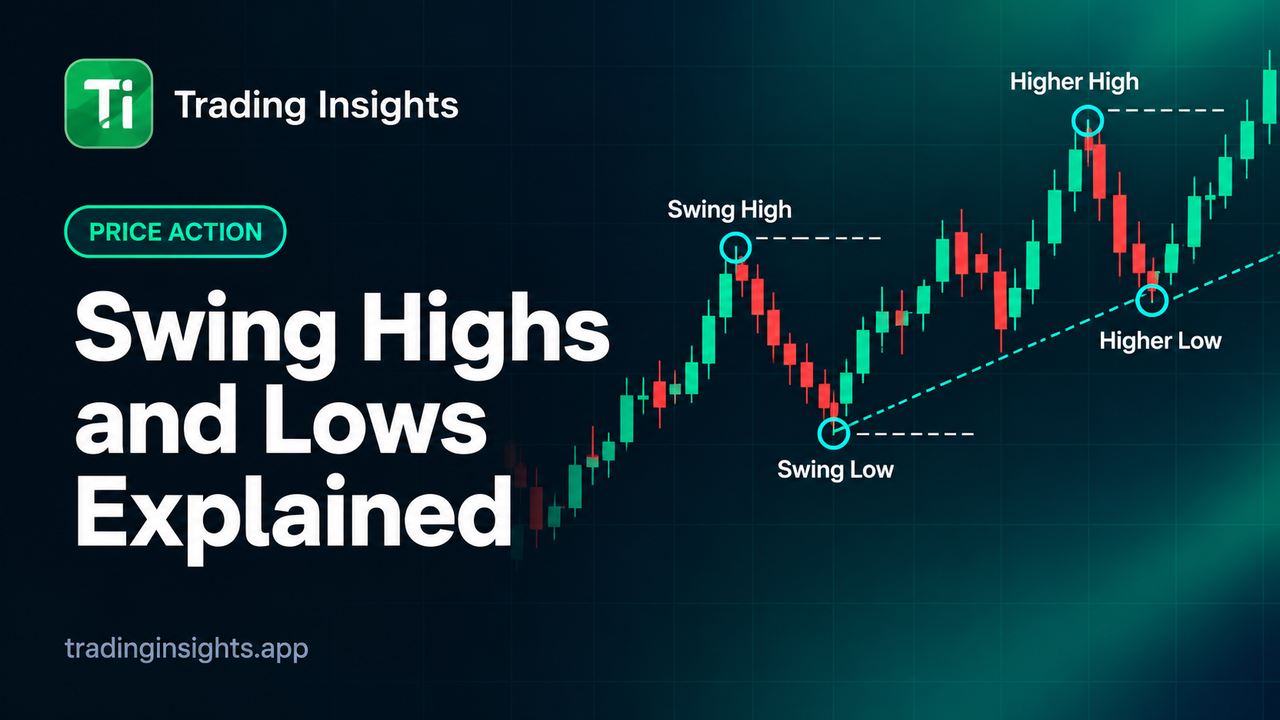
A swing high is a local peak where price stops rising and turns lower; a swing low is a local trough where price stops falling and turns higher. Traders use these points to describe market structure. The exact rules vary: some methods require a fixed number of candles on either side, while others focus on visually significant pivots.
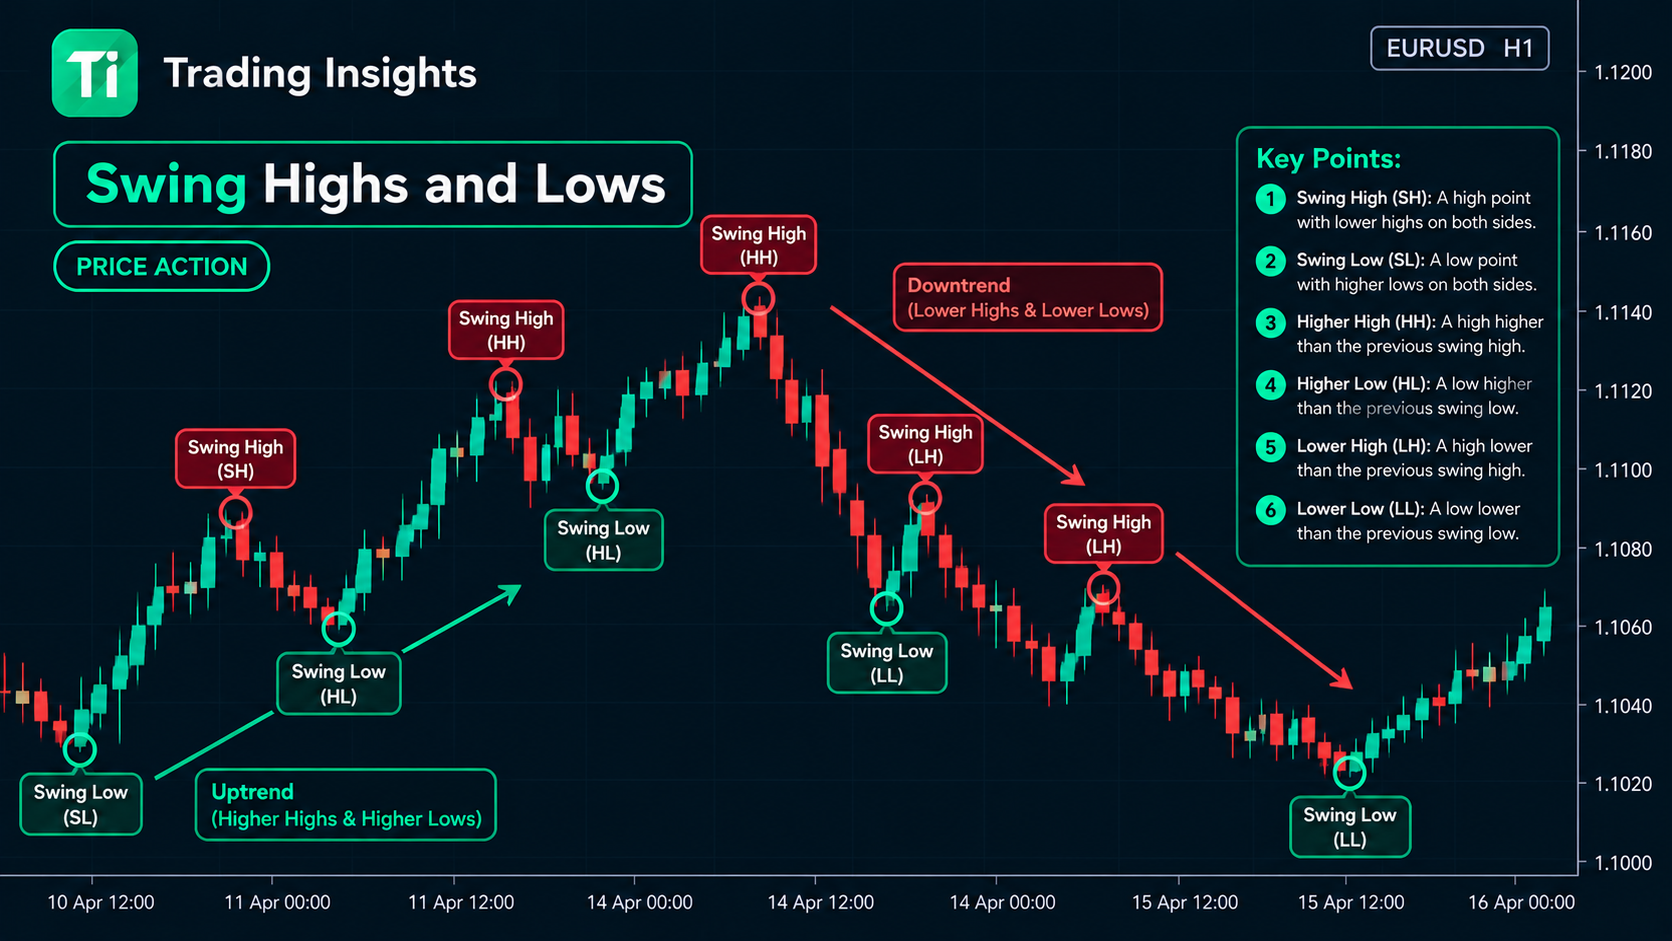
Figure 1: A swing high forms at a local peak and a swing low at a local trough.
Mark swings consistently
Choose a rule before analyzing a chart. For example, a pivot method may require a candle's high to exceed the highs of a set number of candles on both sides. A stricter rule usually marks fewer, larger swings; a looser rule marks more small pivots. Neither is universally best—the right choice depends on timeframe and purpose.
Reading the sequence
Higher highs and higher lows often describe an uptrend.
Lower highs and lower lows often describe a downtrend.
Overlapping swings with no clear progression may describe a range.
Why swing selection matters
BOS and CHoCH labels depend on which swing is considered meaningful. If you keep changing swing points after seeing what price did next, your analysis becomes hindsight-driven. Use a stable method, check the larger timeframe, and accept that swing identification is partly rule-dependent.
Practice by marking swings on historical charts without looking ahead, then record how often your chosen rules remain useful as new candles form.